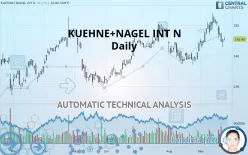
KUEHNE+NAGEL INT N - Daily - Technical analysis published on 09/25/2019 (GMT)
- 207
- 0
- Who voted?
Click here for a new analysis!
- Timeframe : Daily
- - Analysis generated on
- Status : TARGET REACHED

Summary of the analysis

Additional analysis
Quotes
The KUEHNE+NAGEL INT N price is 145.45 CHF. The price has increased by +0.17% since the last closing with the lowest point at 144.90 CHF and the highest point at 146.30 CHF. The deviation from the price is +0.38% for the low point and -0.58% for the high point.A bearish gap was detected at the opening by the Central Gaps scanner. There are a lot of sellers and they have the upper hand in the very short term.
Opening Gap DOWN
Type : Bearish
Timeframe : Openning
A study of price movements over other periods shows the following variations:
Near a new LOW record (1 month)
Type : Bearish
Timeframe : Weekly
Technical
Technical analysis of this Daily chart of KUEHNE+NAGEL INT N indicates that the overall trend is bullish. 64.29% of the signals given by moving averages are bullish. Caution: the neutral signals currently given by the short-term moving averages indicate that this bullish trend is showing signs of running out of steam. The Central Indicators market scanner is currently detecting several bearish signals that could impact this trend:
Bearish trend reversal : adaptative moving average 20
Type : Bearish
Timeframe : Daily
Bearish price crossover with Moving Average 20
Type : Bearish
Timeframe : Daily
Bearish price crossover with adaptative moving average 20
Type : Bearish
Timeframe : Daily
An assessment of technical indicators does not currently provide any relevant information on the direction of future price movements.
Caution: the Central Indicators scanner currently detects an excess:
Williams %R indicator is oversold : under -80
Type : Neutral
Timeframe : Daily
RSI indicator is back under 50
Type : Bearish
Timeframe : Daily
MACD crosses DOWN its Moving Average
Type : Bearish
Timeframe : Daily
Price is back under the pivot point
Type : Bearish
Timeframe : Daily
Price is back under the pivot point
Type : Bearish
Timeframe : Weekly
An analysis of the price chart with the Central Patterns scanner (detector of chart patterns and resistances and supports) shows several results that can have an impact on the price change:
Horizontal resistance is broken
Type : Bullish
Timeframe : Daily
Support of channel is broken
Type : Bearish
Timeframe : Daily
The Central Candlesticks scanner which studies Japanese candlesticks did not detect anything.
| S3 | S2 | S1 | Price | R1 | R2 | R3 | |
|---|---|---|---|---|---|---|---|
| ProTrendLines | 131.56 | 138.76 | 143.99 | 145.45 | 148.50 | 152.75 | 161.95 |
| Change (%) | -9.55% | -4.60% | -1.00% | - | +2.10% | +5.02% | +11.34% |
| Change | -13.89 | -6.69 | -1.46 | - | +3.05 | +7.30 | +16.50 |
| Level | Intermediate | Major | Major | - | Major | Minor | Intermediate |
To determine price objectives, it is also possible to use the pivot points. Here is the price position in relation to pivot points:
| Pivot points | S3 | S2 | S1 | PP | R1 | R2 | R3 |
|---|---|---|---|---|---|---|---|
| Standard | 140.57 | 142.53 | 143.52 | 145.48 | 146.47 | 148.43 | 149.42 |
| Camarilla | 143.69 | 143.96 | 144.23 | 144.50 | 144.77 | 145.04 | 145.31 |
| Woodie | 140.08 | 142.29 | 143.03 | 145.24 | 145.98 | 148.19 | 148.93 |
| Fibonacci | 142.53 | 143.66 | 144.36 | 145.48 | 146.61 | 147.31 | 148.43 |
| Pivot points | S3 | S2 | S1 | PP | R1 | R2 | R3 |
|---|---|---|---|---|---|---|---|
| Standard | 134.77 | 139.63 | 142.07 | 146.93 | 149.37 | 154.23 | 156.67 |
| Camarilla | 142.49 | 143.16 | 143.83 | 144.50 | 145.17 | 145.84 | 146.51 |
| Woodie | 133.55 | 139.03 | 140.85 | 146.33 | 148.15 | 153.63 | 155.45 |
| Fibonacci | 139.63 | 142.42 | 144.15 | 146.93 | 149.72 | 151.45 | 154.23 |
| Pivot points | S3 | S2 | S1 | PP | R1 | R2 | R3 |
|---|---|---|---|---|---|---|---|
| Standard | 131.60 | 134.35 | 139.20 | 141.95 | 146.80 | 149.55 | 154.40 |
| Camarilla | 141.96 | 142.66 | 143.35 | 144.05 | 144.75 | 145.44 | 146.14 |
| Woodie | 132.65 | 134.88 | 140.25 | 142.48 | 147.85 | 150.08 | 155.45 |
| Fibonacci | 134.35 | 137.25 | 139.05 | 141.95 | 144.85 | 146.65 | 149.55 |
Numerical data
The following is the status of technical indicators and moving averages registered at the time this technical analysis was created:
| RSI (14): | 48.22 | |
| MACD (12,26,9): | 1.2800 | |
| Directional Movement: | -8.98 | |
| AROON (14): | 50.00 | |
| DEMA (21): | 148.38 | |
| Parabolic SAR (0,02-0,02-0,2): | 153.25 | |
| Elder Ray (13): | -3.10 | |
| Super Trend (3,10): | 143.28 | |
| Zig ZAG (10): | 145.20 | |
| VORTEX (21): | 0.9900 | |
| Stochastique (14,3,5): | 26.00 | |
| TEMA (21): | 148.75 | |
| Williams %R (14): | -78.83 | |
| Chande Momentum Oscillator (20): | -2.00 | |
| Repulse (5,40,3): | -0.8700 | |
| ROCnROLL: | -1 | |
| TRIX (15,9): | 0.1800 | |
| Courbe Coppock: | 6.66 |
| MA7: | 148.46 | |
| MA20: | 146.53 | |
| MA50: | 144.43 | |
| MA100: | 140.98 | |
| MAexp7: | 147.15 | |
| MAexp20: | 146.56 | |
| MAexp50: | 144.40 | |
| MAexp100: | 142.44 | |
| Price / MA7: | -2.03% | |
| Price / MA20: | -0.74% | |
| Price / MA50: | +0.71% | |
| Price / MA100: | +3.17% | |
| Price / MAexp7: | -1.16% | |
| Price / MAexp20: | -0.76% | |
| Price / MAexp50: | +0.73% | |
| Price / MAexp100: | +2.11% |
About author

Online


Add a comment
Comments
0 comments on the analysis KUEHNE+NAGEL INT N - Daily