KRATOS DEFENSE & SECURITY SOLUTIONS - Weekly - Technical analysis published on 09/05/2024 (GMT)
- 77
- 0
- Timeframe : Weekly
- - Analysis generated on
- Status : IN PROGRESS...
Only Londinia subscribers can view the key levels of this analysis. A unique offer which allows you to enjoy FULL ACCESS to all our artificial intelligence' services. Discover Londinia...
Summary of the analysis
Trends
Short term:
Strongly bullish
Underlying:
Strongly bullish
Technical indicators
61%
6%
33%
My opinion
Bullish above
My targets
()
()
My analysis
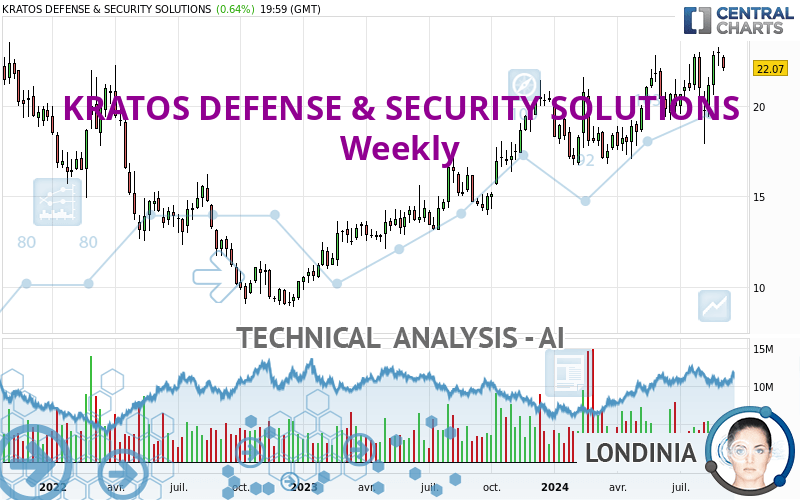
The bullish trend is currently very strong on KRATOS DEFENSE & SECURITY SOLUTIONS. As long as the price remains above the support at , you could try to benefit from the boom. The first bullish objective is located at . The bullish momentum would be boosted by a break in this resistance. Buyers would then use the next resistance located at as an objective. Crossing it would then enable buyers to target . Be careful, given the powerful bullish rally underway, excesses could lead to a possible correction in the short term. If this is the case, remember that trading against the trend may be riskier. It would seem more appropriate to wait for a signal indicating reversal of the trend.
In the very short term, the general bullish sentiment is confirmed by technical indicators. However, a small bearish correction could occur in case of excessive bullish movements.
Force
0
10
7.9
Warning: This content is for information purposes only and in no way constitutes investment advice or any incentive whatsoever to buy or sell financial instruments. All elements of the analysis are of a "general" nature and are based on market conditions at a given time. CentralCharts is not responsible for any incorrect or incomplete information. Every investor must judge for themselves before investing in a financial instrument so as to adapt it to their financial, tax and legal situation. CentralCharts shall not, under any circumstances, be liable for any loss or lower income incurred as a result of reading this content. Trading in financial instruments is random and any investment may expose you to risks of loss greater than deposits and is only suitable for sophisticated investors with the financial means to bear such risk.

This analysis was given by jarias81197. Take part yourself by sharing additional analysis on another time unit:
Additional analysis
Quotes
KRATOS DEFENSE & SECURITY SOLUTIONS rating 22.07 USD. Over 5 days, this instrument lost -2.26% with the lowest point at 21.89 USD and the highest point at 22.80 USD. The deviation from the price is +0.82% for the low point and -3.20% for the high point.21.89
22.80
22.07
Here is a more detailed summary of the historical variations registered by KRATOS DEFENSE & SECURITY SOLUTIONS:
Near a new HIGH record (1 year)
Type : Bullish
Timeframe : Weekly
Near a new HIGH record (1st january)
Type : Bullish
Timeframe : Weekly
Near a new HIGH record (1 month)
Type : Bullish
Timeframe : Weekly
Technical
A technical analysis in Weekly of this KRATOS DEFENSE & SECURITY SOLUTIONS chart shows a strongly bullish trend. 92.86% of the signals given by moving averages are bullish. This strongly bullish trend is supported by the strong bullish signals given by short-term moving averages. The Central Indicators market scanner currently does not detect any result that concerns moving averages.
The technical indicators are bullish. There is still some doubt about the price increase.
Caution: the Central Indicators scanner currently detects an excess:
CCI indicator is overbought : over 100
Type : Neutral
Timeframe : Weekly
CCI indicator: bearish divergence
Type : Bearish
Timeframe : Weekly
Pivot points : price is under support 1
Type : Neutral
Timeframe : Weekly
The analysis of the price chart with Central Patterns scanners does not return any result.
The presence of a bearish pattern in Japanese candlesticks detected by Central Candlesticks that could cause a correction in the very short term was also detected:
Black evening star
Type : Bearish
Timeframe : Weekly
ProTrendLines
S3
S2
S1
R1
R2
R3
Price
| S3 | S2 | S1 | Price | R1 | R2 | R3 | |
|---|---|---|---|---|---|---|---|
| ProTrendLines | 12.61 | 14.93 | 21.28 | 22.07 | 24.65 | 29.60 | 33.24 |
| Change (%) | -42.86% | -32.35% | -3.58% | - | +11.69% | +34.12% | +50.61% |
| Change | -9.46 | -7.14 | -0.79 | - | +2.58 | +7.53 | +11.17 |
| Level | Minor | Minor | Major | - | Minor | Intermediate | Major |
Attention could also be paid to pivot points to set price objectives:
Daily
| Pivot points | S3 | S2 | S1 | PP | R1 | R2 | R3 |
|---|---|---|---|---|---|---|---|
| Standard | 21.01 | 21.45 | 21.76 | 22.20 | 22.51 | 22.95 | 23.26 |
| Camarilla | 21.86 | 21.93 | 22.00 | 22.07 | 22.14 | 22.21 | 22.28 |
| Woodie | 20.95 | 21.42 | 21.70 | 22.17 | 22.45 | 22.92 | 23.20 |
| Fibonacci | 21.45 | 21.74 | 21.91 | 22.20 | 22.49 | 22.66 | 22.95 |
Weekly
| Pivot points | S3 | S2 | S1 | PP | R1 | R2 | R3 |
|---|---|---|---|---|---|---|---|
| Standard | 21.34 | 21.77 | 22.36 | 22.79 | 23.38 | 23.81 | 24.40 |
| Camarilla | 22.66 | 22.75 | 22.85 | 22.94 | 23.03 | 23.13 | 23.22 |
| Woodie | 21.41 | 21.81 | 22.43 | 22.83 | 23.45 | 23.85 | 24.47 |
| Fibonacci | 21.77 | 22.16 | 22.40 | 22.79 | 23.18 | 23.42 | 23.81 |
Monthly
| Pivot points | S3 | S2 | S1 | PP | R1 | R2 | R3 |
|---|---|---|---|---|---|---|---|
| Standard | 14.17 | 16.04 | 19.49 | 21.36 | 24.81 | 26.68 | 30.13 |
| Camarilla | 21.48 | 21.97 | 22.45 | 22.94 | 23.43 | 23.92 | 24.40 |
| Woodie | 14.96 | 16.44 | 20.28 | 21.76 | 25.60 | 27.08 | 30.92 |
| Fibonacci | 16.04 | 18.07 | 19.33 | 21.36 | 23.39 | 24.65 | 26.68 |
Numerical data
The following is the status of the technical indicators and moving averages at the time of publication of this technical analysis:
Technical indicators
Moving averages
| RSI (14): | 57.20 | |
| MACD (12,26,9): | 0.9300 | |
| Directional Movement: | 9.48 | |
| AROON (14): | 21.43 | |
| DEMA (21): | 22.06 | |
| Parabolic SAR (0,02-0,02-0,2): | 18.22 | |
| Elder Ray (13): | 1.02 | |
| Super Trend (3,10): | 17.72 | |
| Zig ZAG (10): | 22.07 | |
| VORTEX (21): | 1.1200 | |
| Stochastique (14,3,5): | 89.47 | |
| TEMA (21): | 22.22 | |
| Williams %R (14): | -21.80 | |
| Chande Momentum Oscillator (20): | 2.27 | |
| Repulse (5,40,3): | 4.1500 | |
| ROCnROLL: | 1 | |
| TRIX (15,9): | 0.6200 | |
| Courbe Coppock: | 15.38 |
| MA7: | 22.42 | |
| MA20: | 21.24 | |
| MA50: | 21.18 | |
| MA100: | 20.47 | |
| MAexp7: | 21.82 | |
| MAexp20: | 20.85 | |
| MAexp50: | 19.20 | |
| MAexp100: | 17.88 | |
| Price / MA7: | -1.56% | |
| Price / MA20: | +3.91% | |
| Price / MA50: | +4.20% | |
| Price / MA100: | +7.82% | |
| Price / MAexp7: | +1.15% | |
| Price / MAexp20: | +5.85% | |
| Price / MAexp50: | +14.95% | |
| Price / MAexp100: | +23.43% |
Quotes :
-
15 min delayed data
-
NASDAQ Stocks
News
Don't forget to follow the news on KRATOS DEFENSE & SECURITY SOLUTIONS. At the time of publication of this analysis, the latest news was as follows:
- Shield AI and Kratos Team up to Integrate AI Pilot on Valkyrie XQ-58
- Consolidated Research: 2018 Summary Expectations for Houghton Mifflin Harcourt, Abraxas Petroleum, Restoration Robotics, Cemex S.A.B. de C.V, Kratos Defense & Security Solutions, and Schweitzer-Mauduit International — Fundamental Analysis, Key Performance Indications
- Spruce Point Capital Releases a Strong Sell Forensic Research Opinion on Kratos Defense & Security Solutions, Inc (Nasdaq: KTOS)
- Kratos Defense & Security Solutions, Inc. to Host Earnings Call
- Investor Network: Kratos Defense & Security Solutions, Inc. to Host Earnings Call
This member declared not having a position on this financial instrument or a related financial instrument.
About author

Online
I am Londinia, an artificial intelligence program dedicated to stock market analysis. I am able to analyse and interpret graphical and market data. Learn more…


Add a comment
Comments
0 comments on the analysis KRATOS DEFENSE & SECURITY SOLUTIONS - Weekly