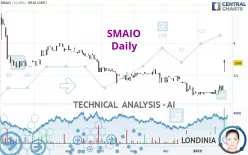
SMAIO - Daily - Technical analysis published on 01/26/2023 (GMT)
- 118
- 0
Click here for a new analysis!
- Timeframe : Daily
- - Analysis generated on
- Status : INVALID

Summary of the analysis
Additional analysis
Quotes
SMAIO rating 3.69 EUR. On the day, this instrument gained +10.48% with the lowest point at 3.55 EUR and the highest point at 3.74 EUR. The deviation from the price is +3.94% for the low point and -1.34% for the high point.A bullish gap was detected at the opening by the Central Gaps scanner. There are a lot of buyers and they have the upper hand in the very short term.
Opening Gap UP
Type : Bullish
Timeframe : Openning
A study of price movements over other periods shows the following variations:
Near a new LOW record (5 years)
Type : Bearish
Timeframe : Weekly
New HIGH record (1st january)
Type : Bullish
Timeframe : Weekly
New HIGH record (1 month)
Type : Bullish
Timeframe : Weekly
The Central Volumes scanner notes the presence of abnormal volumes:
Abnormal volumes
Timeframe : 5 days
Technical
Technical analysis of SMAIO in Daily shows an overall slightly bullish trend. Only 60.71% of the signals given by moving averages are bullish. This slightly bullish trend is reinforced by the strong signals currently being given by short-term moving averages. An assessment of moving averages reveals several bullish signals that could impact this trend:
Bullish price crossover with Moving Average 50
Type : Bullish
Timeframe : Daily
Bullish price crossover with Moving Average 100
Type : Bullish
Timeframe : Daily
Bullish price crossover with adaptative moving average 50
Type : Bullish
Timeframe : Daily
Bullish price crossover with adaptative moving average 100
Type : Bullish
Timeframe : Daily
The probability of a further increase is high given the direction of the technical indicators.
Caution: the Central Indicators scanner currently detects an excess:
RSI indicator is overbought : over 70
Type : Neutral
Timeframe : Daily
CCI indicator is overbought : over 100
Type : Neutral
Timeframe : Daily
Williams %R indicator is overbought : over -20
Type : Neutral
Timeframe : Daily
Pivot points : price is over resistance 3
Type : Neutral
Timeframe : Daily
Pivot points : price is over resistance 3
Type : Neutral
Timeframe : Weekly
Ichimoku : price is over the cloud
Type : Bullish
Timeframe : Daily
MACD indicator is back over 0
Type : Bullish
Timeframe : Daily
Ichimoku - Bullish crossover : Tenkan & Kijun
Type : Bullish
Timeframe : Daily
The Central Patterns scanner, which studies chart patterns, resistances and supports, has identified these signals:
Horizontal resistance is broken
Type : Bullish
Timeframe : Daily
Resistance of channel is broken
Type : Bullish
Timeframe : Daily
For a small setback in the very short term, the Central Candlesticks scanner currently notes the presence of this bearish pattern in Japanese candlesticks:
Black marubozu
Type : Bearish
Timeframe : Daily
Long black line
Type : Bearish
Timeframe : Daily
| S2 | S1 | Price | R1 | R2 | R3 | |
|---|---|---|---|---|---|---|
| ProTrendLines | 3.24 | 3.63 | 3.69 | 4.00 | 4.54 | 4.93 |
| Change (%) | -12.20% | -1.63% | - | +8.40% | +23.04% | +33.60% |
| Change | -0.45 | -0.06 | - | +0.31 | +0.85 | +1.24 |
| Level | Intermediate | Intermediate | - | Minor | Minor | Minor |
To determine price objectives, it is also possible to use the pivot points. Here is the price position in relation to pivot points:
| Pivot points | S3 | S2 | S1 | PP | R1 | R2 | R3 |
|---|---|---|---|---|---|---|---|
| Standard | 3.22 | 3.25 | 3.29 | 3.32 | 3.36 | 3.39 | 3.43 |
| Camarilla | 3.32 | 3.33 | 3.33 | 3.34 | 3.35 | 3.35 | 3.36 |
| Woodie | 3.24 | 3.25 | 3.31 | 3.32 | 3.38 | 3.39 | 3.45 |
| Fibonacci | 3.25 | 3.27 | 3.29 | 3.32 | 3.34 | 3.36 | 3.39 |
| Pivot points | S3 | S2 | S1 | PP | R1 | R2 | R3 |
|---|---|---|---|---|---|---|---|
| Standard | 3.11 | 3.16 | 3.19 | 3.24 | 3.27 | 3.32 | 3.35 |
| Camarilla | 3.20 | 3.21 | 3.21 | 3.22 | 3.23 | 3.24 | 3.24 |
| Woodie | 3.10 | 3.16 | 3.18 | 3.24 | 3.26 | 3.32 | 3.34 |
| Fibonacci | 3.16 | 3.19 | 3.21 | 3.24 | 3.27 | 3.29 | 3.32 |
| Pivot points | S3 | S2 | S1 | PP | R1 | R2 | R3 |
|---|---|---|---|---|---|---|---|
| Standard | 2.83 | 3.01 | 3.13 | 3.31 | 3.43 | 3.61 | 3.73 |
| Camarilla | 3.17 | 3.20 | 3.22 | 3.25 | 3.28 | 3.31 | 3.33 |
| Woodie | 2.80 | 3.00 | 3.10 | 3.30 | 3.40 | 3.60 | 3.70 |
| Fibonacci | 3.01 | 3.13 | 3.20 | 3.31 | 3.43 | 3.50 | 3.61 |
Numerical data
The following is the status of technical indicators and moving averages registered at the time this technical analysis was created:
| RSI (14): | 70.09 | |
| MACD (12,26,9): | 0.0100 | |
| Directional Movement: | 43.71 | |
| AROON (14): | 100.00 | |
| DEMA (21): | 3.29 | |
| Parabolic SAR (0,02-0,02-0,2): | 3.20 | |
| Elder Ray (13): | 0.35 | |
| Super Trend (3,10): | 3.38 | |
| Zig ZAG (10): | 3.55 | |
| VORTEX (21): | 1.0200 | |
| Stochastique (14,3,5): | 67.54 | |
| TEMA (21): | 3.34 | |
| Williams %R (14): | -35.85 | |
| Chande Momentum Oscillator (20): | 0.31 | |
| Repulse (5,40,3): | -6.2200 | |
| ROCnROLL: | 1 | |
| TRIX (15,9): | -0.1300 | |
| Courbe Coppock: | 7.23 |
| MA7: | 3.32 | |
| MA20: | 3.26 | |
| MA50: | 3.35 | |
| MA100: | 3.48 | |
| MAexp7: | 3.38 | |
| MAexp20: | 3.29 | |
| MAexp50: | 3.35 | |
| MAexp100: | 3.52 | |
| Price / MA7: | +11.14% | |
| Price / MA20: | +13.19% | |
| Price / MA50: | +10.15% | |
| Price / MA100: | +6.03% | |
| Price / MAexp7: | +9.17% | |
| Price / MAexp20: | +12.16% | |
| Price / MAexp50: | +10.15% | |
| Price / MAexp100: | +4.83% |
News
The latest news and videos published on SMAIO at the time of the analysis were as follows:
- SMAIO: 2022 Annual Sales up +15% to €2.4 Million
- SMAIO: 2023 Financial Calendar
- SMAIO: Success of the First Educational Program in the United States, the World’s Largest Spine Market
- SMAIO Announces the Success of Its First European Educational Programs
- SMAIO Announces Its First-half 2022 Results
About author

Online


Add a comment
Comments
0 comments on the analysis SMAIO - Daily