CLARIANE - 1H - Technical analysis published on 01/29/2025 (GMT)
- 62
- 0
- Timeframe : 1H
- - Analysis generated on
- Status : NEUTRAL
Summary of the analysis

Additional analysis
Quotes
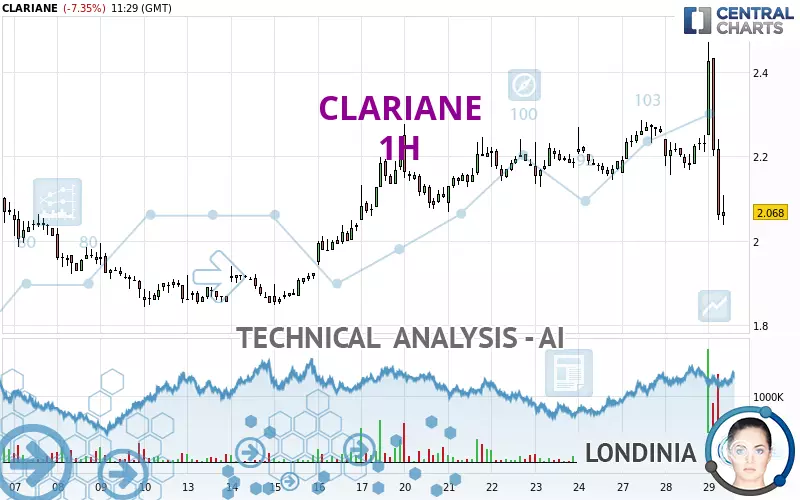
CLARIANE rating 2.068 EUR. The price registered a decrease of -7.35% on the session with the lowest point at 2.036 EUR and the highest point at 2.470 EUR. The deviation from the price is +1.57% for the low point and -16.28% for the high point.A bullish opening was detected by the Central Gaps scanner. Buyers are trying to impose a bullish momentum in the very short term.
Bullish opening
Type : Bullish
Timeframe : Openning
Here is a more detailed summary of the historical variations registered by CLARIANE:
New HIGH record (1st january)
Type : Bullish
Timeframe : Weekly
New HIGH record (1 month)
Type : Bullish
Timeframe : Weekly
Technical
Technical analysis of CLARIANE in 1H shows an overall slightly bullish trend. Only 53.57% of the signals given by moving averages are bullish. This slightly bullish trend could turn neutral or reverse given the slightly bearish signals currently being given by short-term moving averages. The Central Indicators scanner detects bearish signals on moving averages that could impact this trend:
Bearish trend reversal : Moving Average 20
Type : Bearish
Timeframe : 1 hour
Bearish trend reversal : Moving Average 50
Type : Bearish
Timeframe : 1 hour
Bearish trend reversal : adaptative moving average 50
Type : Bearish
Timeframe : 1 hour
Bearish trend reversal : adaptative moving average 100
Type : Bearish
Timeframe : 1 hour
An assessment of technical indicators does not currently provide any relevant information to suggest whether the signal given by the technical indicators is more bullish or bearish.
But beware of excesses. The Central Indicators scanner currently detects this:
CCI indicator is oversold : under -100
Type : Neutral
Timeframe : 1 hour
Previous candle closed under Bollinger bands
Type : Neutral
Timeframe : 1 hour
Williams %R indicator is oversold : under -80
Type : Neutral
Timeframe : 1 hour
Pivot points : price is under support 3
Type : Neutral
Timeframe : 1 hour
MACD indicator is back under 0
Type : Bearish
Timeframe : 1 hour
The Central Patterns scanner, which studies chart patterns, resistances and supports, has identified this signal:
Resistance of channel is broken
Type : Bullish
Timeframe : 1 hour
No result was found by the Central Candlesticks scanner on Japanese candlesticks.
| S3 | S2 | S1 | Price | R1 | R2 | R3 | |
|---|---|---|---|---|---|---|---|
| ProTrendLines | 1.851 | 1.919 | 2.059 | 2.068 | 2.156 | 2.246 | 2.288 |
| Change (%) | -10.49% | -7.21% | -0.44% | - | +4.26% | +8.61% | +10.64% |
| Change | -0.217 | -0.149 | -0.009 | - | +0.088 | +0.178 | +0.220 |
| Level | Major | Minor | Minor | - | Minor | Minor | Major |
Pivot points can also be used to set your price objectives. Here is the price situation in relation to pivot points:
| Pivot points | S3 | S2 | S1 | PP | R1 | R2 | R3 |
|---|---|---|---|---|---|---|---|
| Standard | 2.081 | 2.119 | 2.175 | 2.213 | 2.269 | 2.307 | 2.363 |
| Camarilla | 2.206 | 2.215 | 2.223 | 2.232 | 2.241 | 2.249 | 2.258 |
| Woodie | 2.091 | 2.124 | 2.185 | 2.218 | 2.279 | 2.312 | 2.373 |
| Fibonacci | 2.119 | 2.155 | 2.177 | 2.213 | 2.249 | 2.271 | 2.307 |
| Pivot points | S3 | S2 | S1 | PP | R1 | R2 | R3 |
|---|---|---|---|---|---|---|---|
| Standard | 1.871 | 1.969 | 2.079 | 2.177 | 2.287 | 2.385 | 2.495 |
| Camarilla | 2.131 | 2.150 | 2.169 | 2.188 | 2.207 | 2.226 | 2.245 |
| Woodie | 1.876 | 1.972 | 2.084 | 2.180 | 2.292 | 2.388 | 2.500 |
| Fibonacci | 1.969 | 2.049 | 2.098 | 2.177 | 2.257 | 2.306 | 2.385 |
| Pivot points | S3 | S2 | S1 | PP | R1 | R2 | R3 |
|---|---|---|---|---|---|---|---|
| Standard | 1.353 | 1.513 | 1.801 | 1.961 | 2.249 | 2.409 | 2.697 |
| Camarilla | 1.965 | 2.006 | 2.047 | 2.088 | 2.129 | 2.170 | 2.211 |
| Woodie | 1.416 | 1.545 | 1.864 | 1.993 | 2.312 | 2.441 | 2.760 |
| Fibonacci | 1.513 | 1.685 | 1.790 | 1.961 | 2.133 | 2.238 | 2.409 |
Numerical data
The following are the details of the technical indicators and moving averages that were collected to generate this technical analysis:
| RSI (14): | 47.08 | |
| MACD (12,26,9): | 0.0120 | |
| Directional Movement: | 12.851 | |
| AROON (14): | 57.143 | |
| DEMA (21): | 2.247 | |
| Parabolic SAR (0,02-0,02-0,2): | 2.168 | |
| Elder Ray (13): | -0.025 | |
| Super Trend (3,10): | 2.428 | |
| Zig ZAG (10): | 2.164 | |
| VORTEX (21): | 0.9870 | |
| Stochastique (14,3,5): | 36.09 | |
| TEMA (21): | 2.237 | |
| Williams %R (14): | -100.00 | |
| Chande Momentum Oscillator (20): | -0.106 | |
| Repulse (5,40,3): | -8.8240 | |
| ROCnROLL: | 2 | |
| TRIX (15,9): | 0.0770 | |
| Courbe Coppock: | 0.77 |
| MA7: | 2.203 | |
| MA20: | 2.075 | |
| MA50: | 1.946 | |
| MA100: | 1.865 | |
| MAexp7: | 2.236 | |
| MAexp20: | 2.232 | |
| MAexp50: | 2.198 | |
| MAexp100: | 2.141 | |
| Price / MA7: | -6.13% | |
| Price / MA20: | -0.34% | |
| Price / MA50: | +6.27% | |
| Price / MA100: | +10.88% | |
| Price / MAexp7: | -7.51% | |
| Price / MAexp20: | -7.35% | |
| Price / MAexp50: | -5.91% | |
| Price / MAexp100: | -3.41% |
News
The last news published on CLARIANE at the time of the generation of this analysis was as follows:
- Clariane: Renewal of the Revolving Credit Facility for a Six-Month Period
- Clariane: Half Year 2023 Results
- Clariane Delivers Main Financing Milestones
- CLARIANE: Result of the option for the payment of the dividend in shares for the financial year 2022
- Clariane: Transfer of the Liquidity Contract
About author

Online


Add a comment
Comments
0 comments on the analysis CLARIANE - 1H