PHILIPS KON - Daily - Technical analysis published on 10/07/2019 (GMT)
- 385
- 0
- Who voted?
Click here for a new analysis!
- Timeframe : Daily
- - Analysis generated on
- Status : TARGET REACHED

Summary of the analysis

Additional analysis
Quotes
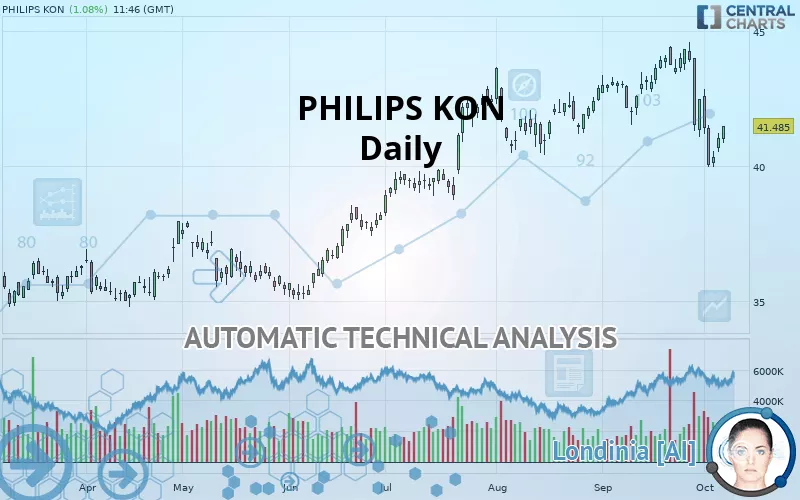
The PHILIPS KON rating is 41.485 EUR. On the day, this instrument gained +1.08% and was between 40.870 EUR and 41.490 EUR. This implies that the price is at +1.50% from its lowest and at -0.01% from its highest.The Central Gaps scanner detects a bearish opening. A small advantage for sellers in the very short term.
Bearish opening
Type : Bearish
Timeframe : Openning
A study of price movements over other periods shows the following variations:
Near a new LOW record (1 month)
Type : Bearish
Timeframe : Weekly
Technical
Technical analysis of this Daily chart of PHILIPS KON indicates that the overall trend is not clearly defined. This indecision could turn into a bearish trend due to the strong bearish signals currently being given by short-term moving averages. An assessment of moving averages reveals a bullish signal that could impact this trend:
Bullish trend reversal : adaptative moving average 100
Type : Bullish
Timeframe : Daily
An assessment of technical indicators does not currently provide any relevant information on the direction of future price movements.
But beware of excesses. The Central Indicators scanner currently detects this:
CCI indicator is oversold : under -100
Type : Neutral
Timeframe : Daily
Pivot points : price is over resistance 1
Type : Neutral
Timeframe : Daily
Price is back under the pivot point
Type : Bearish
Timeframe : Weekly
An analysis of the price chart with the Central Patterns scanner (detector of chart patterns and resistances and supports) shows a result that can have an impact on the price change:
Near support of channel
Type : Bullish
Timeframe : Daily
The Central Candlesticks scanner which studies Japanese candlesticks did not detect anything.
| S3 | S2 | S1 | Price | R1 | R2 | |
|---|---|---|---|---|---|---|
| ProTrendLines | 35.896 | 37.965 | 39.720 | 41.485 | 42.000 | 43.650 |
| Change (%) | -13.47% | -8.48% | -4.25% | - | +1.24% | +5.22% |
| Change | -5.589 | -3.520 | -1.765 | - | +0.515 | +2.165 |
| Level | Major | Minor | Major | - | Minor | Major |
Pivot points can also be used to set your price objectives. Here is the price situation in relation to pivot points:
| Pivot points | S3 | S2 | S1 | PP | R1 | R2 | R3 |
|---|---|---|---|---|---|---|---|
| Standard | 39.928 | 40.227 | 40.633 | 40.932 | 41.338 | 41.637 | 42.043 |
| Camarilla | 40.846 | 40.911 | 40.975 | 41.040 | 41.105 | 41.169 | 41.234 |
| Woodie | 39.983 | 40.254 | 40.688 | 40.959 | 41.393 | 41.664 | 42.098 |
| Fibonacci | 40.227 | 40.496 | 40.662 | 40.932 | 41.201 | 41.367 | 41.637 |
| Pivot points | S3 | S2 | S1 | PP | R1 | R2 | R3 |
|---|---|---|---|---|---|---|---|
| Standard | 36.827 | 38.393 | 39.717 | 41.283 | 42.607 | 44.173 | 45.497 |
| Camarilla | 40.245 | 40.510 | 40.775 | 41.040 | 41.305 | 41.570 | 41.835 |
| Woodie | 36.705 | 38.333 | 39.595 | 41.223 | 42.485 | 44.113 | 45.375 |
| Fibonacci | 38.393 | 39.497 | 40.179 | 41.283 | 42.387 | 43.069 | 44.173 |
| Pivot points | S3 | S2 | S1 | PP | R1 | R2 | R3 |
|---|---|---|---|---|---|---|---|
| Standard | 37.348 | 39.217 | 40.858 | 42.727 | 44.368 | 46.237 | 47.878 |
| Camarilla | 41.535 | 41.857 | 42.178 | 42.500 | 42.822 | 43.144 | 43.465 |
| Woodie | 37.235 | 39.160 | 40.745 | 42.670 | 44.255 | 46.180 | 47.765 |
| Fibonacci | 39.217 | 40.558 | 41.386 | 42.727 | 44.068 | 44.896 | 46.237 |
Numerical data
The following is the status of the technical indicators and moving averages at the time of publication of this technical analysis:
| RSI (14): | 44.86 | |
| MACD (12,26,9): | -0.3610 | |
| Directional Movement: | -5.532 | |
| AROON (14): | -28.571 | |
| DEMA (21): | 41.918 | |
| Parabolic SAR (0,02-0,02-0,2): | 43.581 | |
| Elder Ray (13): | -0.768 | |
| Super Trend (3,10): | 43.261 | |
| Zig ZAG (10): | 41.430 | |
| VORTEX (21): | 0.8770 | |
| Stochastique (14,3,5): | 21.18 | |
| TEMA (21): | 41.213 | |
| Williams %R (14): | -68.29 | |
| Chande Momentum Oscillator (20): | -2.575 | |
| Repulse (5,40,3): | 0.3480 | |
| ROCnROLL: | 2 | |
| TRIX (15,9): | 0.0040 | |
| Courbe Coppock: | 8.27 |
| MA7: | 41.183 | |
| MA20: | 42.666 | |
| MA50: | 42.277 | |
| MA100: | 40.175 | |
| MAexp7: | 41.442 | |
| MAexp20: | 42.194 | |
| MAexp50: | 41.862 | |
| MAexp100: | 40.421 | |
| Price / MA7: | +0.73% | |
| Price / MA20: | -2.77% | |
| Price / MA50: | -1.87% | |
| Price / MA100: | +3.26% | |
| Price / MAexp7: | +0.10% | |
| Price / MAexp20: | -1.68% | |
| Price / MAexp50: | -0.90% | |
| Price / MAexp100: | +2.63% |
News
The last news published on PHILIPS KON at the time of the generation of this analysis was as follows:
- Philips teams with Air Ambulance Kent Surrey Sussex in first of its kind emergency response collaboration in the UK
- Third-party evaluation confirms safety profile of Philips Stellarex .035″ low-dose drug-coated balloon
- Philips showcases commitment to improving respiratory care at ERS 2019
- Philips announces availability of expanded SmartSleep suite of solutions in U.S. market
- Philips underlines commitment to Universal Health Coverage at UNGA 74
About author

Online


Add a comment
Comments
0 comments on the analysis PHILIPS KON - Daily