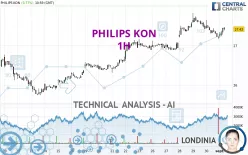
PHILIPS KON - 1H - Technical analysis published on 09/02/2024 (GMT)
- 169
- 0
Click here for a new analysis!
- Timeframe : 1H
- - Analysis generated on
- Status : INVALID

Summary of the analysis

Additional analysis
Quotes
The PHILIPS KON rating is 27.42 EUR. The price has increased by +0.77% since the last closing and was traded between 27.20 EUR and 27.47 EUR over the period. The price is currently at +0.81% from its lowest and -0.18% from its highest.The Central Gaps scanner detects a bullish opening. A small advantage for buyers in the very short term.
Bullish opening
Type : Bullish
Timeframe : Openning
Here is a more detailed summary of the historical variations registered by PHILIPS KON:
Near a new HIGH record (1 year)
Type : Bullish
Timeframe : Weekly
Near a new HIGH record (1st january)
Type : Bullish
Timeframe : Weekly
Near a new HIGH record (1 month)
Type : Bullish
Timeframe : Weekly
Technical
Technical analysis of PHILIPS KON in 1H shows a strongly overall bullish trend. 82.14% of the signals given by moving averages are bullish. The slightly bullish signals given by the short-term moving averages show a weakening of the global trend. The Central Indicators scanner detects bullish and bearish signals on moving averages that could impact this trend:
Bullish trend reversal : adaptative moving average 20
Type : Bullish
Timeframe : 1 hour
Bearish price crossover with Moving Average 20
Type : Bearish
Timeframe : 1 hour
Bearish price crossover with adaptative moving average 20
Type : Bearish
Timeframe : 1 hour
In fact, Central Analyzer took into account 18 technical indicators and the result was as follows: 9 are bullish, 5 are neutral and 4 are bearish. Central Indicators, the scanner specialised in technical indicators, has identified these signals:
Price is back over the pivot point
Type : Bullish
Timeframe : Weekly
Momentum indicator is back under 0
Type : Bearish
Timeframe : 1 hour
Williams %R indicator is back under -50
Type : Bearish
Timeframe : 1 hour
The Central Patterns scanner, which studies chart patterns, resistances and supports, has identified this signal:
Near resistance of channel
Type : Bearish
Timeframe : 1 hour
The Central Candlesticks scanner which studies Japanese candlesticks did not detect anything.
| S3 | S2 | S1 | Price | R1 | R2 | R3 | |
|---|---|---|---|---|---|---|---|
| ProTrendLines | 26.37 | 26.88 | 27.21 | 27.42 | 27.66 | 29.33 | 33.27 |
| Change (%) | -3.83% | -1.97% | -0.77% | - | +0.88% | +6.97% | +21.33% |
| Change | -1.05 | -0.54 | -0.21 | - | +0.24 | +1.91 | +5.85 |
| Level | Minor | Intermediate | Major | - | Major | Intermediate | Major |
To determine price objectives, it is also possible to use the pivot points. Here is the price position in relation to pivot points:
| Pivot points | S3 | S2 | S1 | PP | R1 | R2 | R3 |
|---|---|---|---|---|---|---|---|
| Standard | 26.54 | 26.86 | 27.03 | 27.35 | 27.52 | 27.84 | 28.01 |
| Camarilla | 27.08 | 27.12 | 27.17 | 27.21 | 27.26 | 27.30 | 27.35 |
| Woodie | 26.48 | 26.82 | 26.97 | 27.31 | 27.46 | 27.80 | 27.95 |
| Fibonacci | 26.86 | 27.04 | 27.16 | 27.35 | 27.53 | 27.65 | 27.84 |
| Pivot points | S3 | S2 | S1 | PP | R1 | R2 | R3 |
|---|---|---|---|---|---|---|---|
| Standard | 25.83 | 26.36 | 26.78 | 27.31 | 27.73 | 28.26 | 28.68 |
| Camarilla | 26.95 | 27.04 | 27.12 | 27.21 | 27.30 | 27.38 | 27.47 |
| Woodie | 25.79 | 26.33 | 26.74 | 27.28 | 27.69 | 28.23 | 28.64 |
| Fibonacci | 26.36 | 26.72 | 26.94 | 27.31 | 27.67 | 27.89 | 28.26 |
| Pivot points | S3 | S2 | S1 | PP | R1 | R2 | R3 |
|---|---|---|---|---|---|---|---|
| Standard | 22.92 | 24.02 | 25.62 | 26.72 | 28.32 | 29.42 | 31.02 |
| Camarilla | 26.47 | 26.72 | 26.96 | 27.21 | 27.46 | 27.71 | 27.95 |
| Woodie | 23.16 | 24.15 | 25.86 | 26.85 | 28.56 | 29.55 | 31.26 |
| Fibonacci | 24.02 | 25.06 | 25.69 | 26.72 | 27.76 | 28.39 | 29.42 |
Numerical data
The following is the status of technical indicators and moving averages registered at the time this technical analysis was created:
| RSI (14): | 53.97 | |
| MACD (12,26,9): | 0.0100 | |
| Directional Movement: | 10.29 | |
| AROON (14): | -57.14 | |
| DEMA (21): | 27.39 | |
| Parabolic SAR (0,02-0,02-0,2): | 27.18 | |
| Elder Ray (13): | 0.06 | |
| Super Trend (3,10): | 27.51 | |
| Zig ZAG (10): | 27.40 | |
| VORTEX (21): | 0.9100 | |
| Stochastique (14,3,5): | 45.58 | |
| TEMA (21): | 27.32 | |
| Williams %R (14): | -53.06 | |
| Chande Momentum Oscillator (20): | -0.11 | |
| Repulse (5,40,3): | 0.1400 | |
| ROCnROLL: | 1 | |
| TRIX (15,9): | 0.0100 | |
| Courbe Coppock: | 1.58 |
| MA7: | 27.20 | |
| MA20: | 26.64 | |
| MA50: | 25.35 | |
| MA100: | 24.39 | |
| MAexp7: | 27.36 | |
| MAexp20: | 27.37 | |
| MAexp50: | 27.25 | |
| MAexp100: | 26.98 | |
| Price / MA7: | +0.81% | |
| Price / MA20: | +2.93% | |
| Price / MA50: | +8.17% | |
| Price / MA100: | +12.42% | |
| Price / MAexp7: | +0.22% | |
| Price / MAexp20: | +0.18% | |
| Price / MAexp50: | +0.62% | |
| Price / MAexp100: | +1.63% |
News
Don't forget to follow the news on PHILIPS KON. At the time of publication of this analysis, the latest news was as follows:
- Carilion Clinic further expands quality cardiac care access with latest Philips innovations at new regional cardiovascular institute in Virginia, US
- Philips and Dutch Isala Hospital renew long-term partnership focused on innovation and affordable, sustainable healthcare
- Philips to repurchase shares for up to EUR 125 million to cover long-term incentive plans
- Philips delivers strong order intake growth in the second quarter, margin improvement and sales growth; reiterates full-year outlook
- Bon Secours Mercy Health and Philips sign multi-year strategic collaboration
About author
Online


Add a comment
Comments
0 comments on the analysis PHILIPS KON - 1H