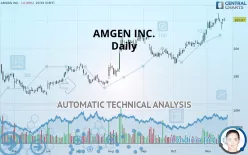
AMGEN INC. - Daily - Technical analysis published on 11/19/2019 (GMT)
- 387
- 0
- Who voted?
Click here for a new analysis!
- Timeframe : Daily
- - Analysis generated on
- Status : TARGET REACHED

Summary of the analysis

Additional analysis
Quotes
AMGEN INC. rating 220.67 USD. The price is lower by -0.09% since the last closing and was traded between 219.21 USD and 221.59 USD over the period. The price is currently at +0.67% from its lowest and -0.42% from its highest.The Central Gaps scanner detects a bullish gap which is a sign that buyers have taken the lead in the very short term.
Opening Gap UP
Type : Bullish
Timeframe : Openning
So that you have an overall view of the price change, here is a table showing the variations over several periods:
Near a new HIGH record (5 years)
Type : Bullish
Timeframe : Weekly
Near a new HIGH record (1 year)
Type : Bullish
Timeframe : Weekly
Near a new HIGH record (1st january)
Type : Bullish
Timeframe : Weekly
Near a new HIGH record (1 month)
Type : Bullish
Timeframe : Weekly
Technical
Technical analysis of AMGEN INC. in Daily shows a strongly overall bullish trend. The signals given by the moving averages are 92.86% bullish. This strong bullish trend is confirmed by the strong signals currently being given by short-term moving averages. The Central Indicators market scanner currently does not detect any result that concerns moving averages.
In fact, 13 technical indicators on 18 studied are currently positioned bullish. But beware of excesses. The Central Indicators scanner currently detects this:
RSI indicator is overbought : over 70
Type : Neutral
Timeframe : Daily
Williams %R indicator is overbought : over -20
Type : Neutral
Timeframe : Daily
Price is back over the pivot point
Type : Bullish
Timeframe : Daily
The analysis of the price chart with Central Patterns scanners does not return any result.
Central Candlesticks, the scanner specialised in Japanese candlesticks, detects a bullish signal that could support the hypothesis of a small rebound in the very short term:
White morning star
Type : Bullish
Timeframe : Daily
| S3 | S2 | S1 | Price | R1 | |
|---|---|---|---|---|---|
| ProTrendLines | 189.14 | 197.76 | 208.89 | 220.67 | 221.31 |
| Change (%) | -14.29% | -10.38% | -5.34% | - | +0.29% |
| Change | -31.53 | -22.91 | -11.78 | - | +0.64 |
| Level | Intermediate | Minor | Major | - | Major |
Pivot points can also be used to set your price objectives. Here is the price situation in relation to pivot points:
| Pivot points | S3 | S2 | S1 | PP | R1 | R2 | R3 |
|---|---|---|---|---|---|---|---|
| Standard | 214.68 | 215.95 | 218.40 | 219.67 | 222.12 | 223.39 | 225.84 |
| Camarilla | 219.84 | 220.18 | 220.52 | 220.86 | 221.20 | 221.54 | 221.88 |
| Woodie | 215.28 | 216.25 | 219.00 | 219.97 | 222.72 | 223.69 | 226.44 |
| Fibonacci | 215.95 | 217.37 | 218.25 | 219.67 | 221.09 | 221.97 | 223.39 |
| Pivot points | S3 | S2 | S1 | PP | R1 | R2 | R3 |
|---|---|---|---|---|---|---|---|
| Standard | 202.81 | 208.18 | 214.52 | 219.89 | 226.23 | 231.60 | 237.94 |
| Camarilla | 217.64 | 218.71 | 219.79 | 220.86 | 221.93 | 223.01 | 224.08 |
| Woodie | 203.30 | 208.42 | 215.01 | 220.13 | 226.72 | 231.84 | 238.43 |
| Fibonacci | 208.18 | 212.65 | 215.42 | 219.89 | 224.36 | 227.13 | 231.60 |
| Pivot points | S3 | S2 | S1 | PP | R1 | R2 | R3 |
|---|---|---|---|---|---|---|---|
| Standard | 171.91 | 180.34 | 196.80 | 205.23 | 221.69 | 230.12 | 246.58 |
| Camarilla | 206.41 | 208.69 | 210.97 | 213.25 | 215.53 | 217.81 | 220.10 |
| Woodie | 175.92 | 182.35 | 200.81 | 207.24 | 225.70 | 232.13 | 250.59 |
| Fibonacci | 180.34 | 189.85 | 195.73 | 205.23 | 214.74 | 220.62 | 230.12 |
Numerical data
The following is the status of the technical indicators and moving averages at the time of publication of this technical analysis:
| RSI (14): | 69.66 | |
| MACD (12,26,9): | 5.0800 | |
| Directional Movement: | 14.87 | |
| AROON (14): | 64.29 | |
| DEMA (21): | 221.24 | |
| Parabolic SAR (0,02-0,02-0,2): | 224.80 | |
| Elder Ray (13): | 3.08 | |
| Super Trend (3,10): | 210.12 | |
| Zig ZAG (10): | 220.67 | |
| VORTEX (21): | 1.1900 | |
| Stochastique (14,3,5): | 75.82 | |
| TEMA (21): | 223.13 | |
| Williams %R (14): | -21.75 | |
| Chande Momentum Oscillator (20): | 7.42 | |
| Repulse (5,40,3): | 1.6800 | |
| ROCnROLL: | 1 | |
| TRIX (15,9): | 0.3500 | |
| Courbe Coppock: | 12.50 |
| MA7: | 220.40 | |
| MA20: | 213.85 | |
| MA50: | 203.84 | |
| MA100: | 197.26 | |
| MAexp7: | 219.55 | |
| MAexp20: | 214.62 | |
| MAexp50: | 206.98 | |
| MAexp100: | 200.11 | |
| Price / MA7: | +0.12% | |
| Price / MA20: | +3.19% | |
| Price / MA50: | +8.26% | |
| Price / MA100: | +11.87% | |
| Price / MAexp7: | +0.51% | |
| Price / MAexp20: | +2.82% | |
| Price / MAexp50: | +6.61% | |
| Price / MAexp100: | +10.27% |
News
Don"t forget to follow the news on AMGEN INC.. At the time of publication of this analysis, the latest news was as follows:
- New Results From COSMIC-HF Presented At AHA 2019 Show Treatment Of Heart Failure Patients With Omecamtiv Mecarbil Was Associated With Neutral Or Improved Measures Of Diastolic Function
- Amgen And The Duke Clinical Research Institute Announce Initiation Of First Large-Scale Registry To Evaluate Real-World Lipid Management And The Effectiveness Of PCSK9 Inhibitors
- The Discovery Of Amgen's Novel Investigational KRAS(G12C) Inhibitor AMG 510 Published In Nature
- Amgen Recommends Rejection Of 'Mini-Tender' Offer From TRC Capital Corporation
- David Meline, Amgen's Chief Financial Officer, To Retire
About author

Online


Add a comment
Comments
0 comments on the analysis AMGEN INC. - Daily