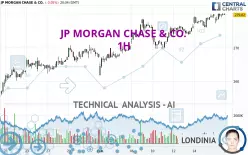
JP MORGAN CHASE & CO. - 1H - Technical analysis published on 02/19/2025 (GMT)
- 131
- 0
Click here for a new analysis!
- Timeframe : 1H
- - Analysis generated on
- Status : INVALID

Summary of the analysis

Additional analysis
Quotes
The JP MORGAN CHASE & CO. rating is 279.80 USD. On the day, this instrument lost -0.05% with the lowest point at 277.22 USD and the highest point at 280.25 USD. The deviation from the price is +0.93% for the low point and -0.16% for the high point.The Central Gaps scanner detects a bearish opening marking the presence of sellers ahead of buyers at the opening but not sufficiently marked to allow the price to register a quotation gap.
Bearish opening
Type : Bearish
Timeframe : Openning
A study of price movements over other periods shows the following variations:
New HIGH record (5 years)
Type : Bullish
Timeframe : Weekly
New HIGH record (1 year)
Type : Bullish
Timeframe : Weekly
New HIGH record (1st january)
Type : Bullish
Timeframe : Weekly
New HIGH record (1 month)
Type : Bullish
Timeframe : Weekly
Technical
A technical analysis in 1H of this JP MORGAN CHASE & CO. chart shows a strongly bullish trend. 92.86% of the signals given by moving averages are bullish. This strongly bullish trend is supported by the strong bullish signals given by short-term moving averages. The Central Indicators market scanner currently does not detect any result that concerns moving averages.
The technical indicators are bullish. There is still some doubt about the price increase.
But beware of excesses. The Central Indicators scanner currently detects this:
CCI indicator is overbought : over 100
Type : Neutral
Timeframe : 1 hour
Williams %R indicator is overbought : over -20
Type : Neutral
Timeframe : 1 hour
MACD crosses DOWN its Moving Average
Type : Bearish
Timeframe : 1 hour
An analysis of the price chart with the Central Patterns scanner (detector of chart patterns and resistances and supports) shows several results that can have an impact on the price change:
Near horizontal support
Type : Bullish
Timeframe : 1 hour
Near support of channel
Type : Bullish
Timeframe : 1 hour
The Central Candlesticks scanner which studies Japanese candlesticks did not detect anything.
| S3 | S2 | S1 | Price | |
|---|---|---|---|---|
| ProTrendLines | 261.89 | 270.75 | 276.90 | 279.80 |
| Change (%) | -6.40% | -3.23% | -1.04% | - |
| Change | -17.91 | -9.05 | -2.90 | - |
| Level | Intermediate | Major | Intermediate | - |
To determine price objectives, it is also possible to use the pivot points. Here is the price position in relation to pivot points:
| Pivot points | S3 | S2 | S1 | PP | R1 | R2 | R3 |
|---|---|---|---|---|---|---|---|
| Standard | 273.37 | 274.70 | 277.32 | 278.65 | 281.27 | 282.60 | 285.22 |
| Camarilla | 278.86 | 279.23 | 279.59 | 279.95 | 280.31 | 280.67 | 281.04 |
| Woodie | 274.03 | 275.02 | 277.98 | 278.97 | 281.93 | 282.92 | 285.88 |
| Fibonacci | 274.70 | 276.21 | 277.14 | 278.65 | 280.16 | 281.09 | 282.60 |
| Pivot points | S3 | S2 | S1 | PP | R1 | R2 | R3 |
|---|---|---|---|---|---|---|---|
| Standard | 261.40 | 265.50 | 271.04 | 275.14 | 280.68 | 284.78 | 290.32 |
| Camarilla | 273.94 | 274.82 | 275.71 | 276.59 | 277.47 | 278.36 | 279.24 |
| Woodie | 262.13 | 265.86 | 271.77 | 275.50 | 281.41 | 285.14 | 291.05 |
| Fibonacci | 265.50 | 269.18 | 271.45 | 275.14 | 278.82 | 281.09 | 284.78 |
| Pivot points | S3 | S2 | S1 | PP | R1 | R2 | R3 |
|---|---|---|---|---|---|---|---|
| Standard | 214.14 | 226.18 | 246.74 | 258.78 | 279.34 | 291.38 | 311.94 |
| Camarilla | 258.34 | 261.32 | 264.31 | 267.30 | 270.29 | 273.28 | 276.27 |
| Woodie | 218.40 | 228.31 | 251.00 | 260.91 | 283.60 | 293.51 | 316.20 |
| Fibonacci | 226.18 | 238.63 | 246.33 | 258.78 | 271.23 | 278.93 | 291.38 |
Numerical data
The following is the status of the technical indicators and moving averages at the time of publication of this technical analysis:
| RSI (14): | 61.45 | |
| MACD (12,26,9): | 1.1100 | |
| Directional Movement: | 10.84 | |
| AROON (14): | 85.72 | |
| DEMA (21): | 280.03 | |
| Parabolic SAR (0,02-0,02-0,2): | 277.95 | |
| Elder Ray (13): | 0.87 | |
| Super Trend (3,10): | 276.41 | |
| Zig ZAG (10): | 279.88 | |
| VORTEX (21): | 1.0900 | |
| Stochastique (14,3,5): | 90.34 | |
| TEMA (21): | 280.11 | |
| Williams %R (14): | -12.06 | |
| Chande Momentum Oscillator (20): | 1.03 | |
| Repulse (5,40,3): | 0.1300 | |
| ROCnROLL: | 1 | |
| TRIX (15,9): | 0.0600 | |
| Courbe Coppock: | 1.44 |
| MA7: | 276.32 | |
| MA20: | 271.05 | |
| MA50: | 253.89 | |
| MA100: | 240.48 | |
| MAexp7: | 279.58 | |
| MAexp20: | 278.56 | |
| MAexp50: | 276.35 | |
| MAexp100: | 272.62 | |
| Price / MA7: | +1.26% | |
| Price / MA20: | +3.23% | |
| Price / MA50: | +10.21% | |
| Price / MA100: | +16.35% | |
| Price / MAexp7: | +0.08% | |
| Price / MAexp20: | +0.45% | |
| Price / MAexp50: | +1.25% | |
| Price / MAexp100: | +2.63% |
News
The latest news and videos published on JP MORGAN CHASE & CO. at the time of the analysis were as follows:
- ATS to Participate in the J.P. Morgan Industrials Conference
- J.P. Morgan Asset Management Announces Liquidation of JPMorgan Sustainable Infrastructure ETF (BLLD)
- J.P. Morgan Asset Management Seeks to Convert $1.3 Billion JPMorgan Unconstrained Debt Fund to JPMorgan Flexible Debt ETF (JFLX)
- /C O R R E C T I O N -- J.P. Morgan Asset Management/
- J.P. Morgan Asset Management, Principals of Georgia Capital and Paran Homes Launch Build-To-Rent Development Company
About author
Online


Add a comment
Comments
0 comments on the analysis JP MORGAN CHASE & CO. - 1H