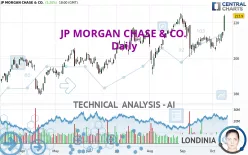
JP MORGAN CHASE & CO. - Daily - Technical analysis published on 10/11/2024 (GMT)
- 139
- 0
Click here for a new analysis!
- Timeframe : Daily
- - Analysis generated on
- Status : TARGET REACHED

Summary of the analysis

Additional analysis
Quotes
JP MORGAN CHASE & CO. rating 223.90 USD. The price has increased by +5.20% since the last closing and was between 215.16 USD and 224.63 USD. This implies that the price is at +4.06% from its lowest and at -0.32% from its highest.The Central Gaps scanner detects a bullish gap which is a sign that buyers have taken the lead in the very short term.
Opening Gap UP
Type : Bullish
Timeframe : Openning
Here is a more detailed summary of the historical variations registered by JP MORGAN CHASE & CO.:
New HIGH record (5 years)
Type : Bullish
Timeframe : Weekly
New HIGH record (1 year)
Type : Bullish
Timeframe : Weekly
New HIGH record (1st january)
Type : Bullish
Timeframe : Weekly
New HIGH record (1 month)
Type : Bullish
Timeframe : Weekly
Technical
Technical analysis of this Daily chart of JP MORGAN CHASE & CO. indicates that the overall trend is strongly bullish. 89.29% of the signals given by moving averages are bullish. This strongly bullish trend is supported by the strong bullish signals given by short-term moving averages. There is no crossing of moving average by the price or crossing of moving averages between themselves.
In fact, 15 technical indicators on 18 studied are currently bullish. But beware of excesses. The Central Indicators scanner currently detects this:
CCI indicator is overbought : over 100
Type : Neutral
Timeframe : Daily
Williams %R indicator is overbought : over -20
Type : Neutral
Timeframe : Daily
Pivot points : price is over resistance 3
Type : Neutral
Timeframe : Daily
Pivot points : price is over resistance 3
Type : Neutral
Timeframe : Weekly
SuperTrend indicator bullish reversal
Type : Bullish
Timeframe : Daily
Ichimoku - Bullish crossover : Tenkan & Kijun
Type : Bullish
Timeframe : Daily
Central Patterns, the market scanner focusing on chart patterns, resistances and supports found these results:
Horizontal resistance is broken
Type : Bullish
Timeframe : Daily
Resistance of channel is broken
Type : Bullish
Timeframe : Daily
The Central Candlesticks scanner which studies Japanese candlesticks did not detect anything.
| S3 | S2 | S1 | Price | |
|---|---|---|---|---|
| ProTrendLines | 202.75 | 215.55 | 223.43 | 223.90 |
| Change (%) | -9.45% | -3.73% | -0.21% | - |
| Change | -21.15 | -8.35 | -0.47 | - |
| Level | Major | Intermediate | Major | - |
Attention could also be paid to pivot points to set price objectives:
| Pivot points | S3 | S2 | S1 | PP | R1 | R2 | R3 |
|---|---|---|---|---|---|---|---|
| Standard | 207.93 | 209.70 | 211.27 | 213.04 | 214.61 | 216.38 | 217.95 |
| Camarilla | 211.92 | 212.23 | 212.53 | 212.84 | 213.15 | 213.45 | 213.76 |
| Woodie | 207.83 | 209.65 | 211.17 | 212.99 | 214.51 | 216.33 | 217.85 |
| Fibonacci | 209.70 | 210.98 | 211.76 | 213.04 | 214.32 | 215.10 | 216.38 |
| Pivot points | S3 | S2 | S1 | PP | R1 | R2 | R3 |
|---|---|---|---|---|---|---|---|
| Standard | 197.09 | 200.09 | 205.66 | 208.66 | 214.23 | 217.23 | 222.80 |
| Camarilla | 208.86 | 209.65 | 210.43 | 211.22 | 212.01 | 212.79 | 213.58 |
| Woodie | 198.37 | 200.73 | 206.94 | 209.30 | 215.51 | 217.87 | 224.08 |
| Fibonacci | 200.09 | 203.37 | 205.39 | 208.66 | 211.94 | 213.96 | 217.23 |
| Pivot points | S3 | S2 | S1 | PP | R1 | R2 | R3 |
|---|---|---|---|---|---|---|---|
| Standard | 175.06 | 187.23 | 198.40 | 210.57 | 221.74 | 233.91 | 245.08 |
| Camarilla | 203.16 | 205.30 | 207.44 | 209.58 | 211.72 | 213.86 | 216.00 |
| Woodie | 174.57 | 186.98 | 197.91 | 210.32 | 221.25 | 233.66 | 244.59 |
| Fibonacci | 187.23 | 196.14 | 201.65 | 210.57 | 219.48 | 224.99 | 233.91 |
Numerical data
The following is the status of technical indicators and moving averages registered at the time this technical analysis was created:
| RSI (14): | 69.77 | |
| MACD (12,26,9): | 1.3500 | |
| Directional Movement: | 19.49 | |
| AROON (14): | 42.86 | |
| DEMA (21): | 212.41 | |
| Parabolic SAR (0,02-0,02-0,2): | 204.99 | |
| Elder Ray (13): | 7.84 | |
| Super Trend (3,10): | 205.33 | |
| Zig ZAG (10): | 223.93 | |
| VORTEX (21): | 1.0300 | |
| Stochastique (14,3,5): | 90.93 | |
| TEMA (21): | 213.59 | |
| Williams %R (14): | -3.55 | |
| Chande Momentum Oscillator (20): | 14.96 | |
| Repulse (5,40,3): | 5.5800 | |
| ROCnROLL: | 1 | |
| TRIX (15,9): | -0.0200 | |
| Courbe Coppock: | 4.42 |
| MA7: | 212.43 | |
| MA20: | 209.77 | |
| MA50: | 210.18 | |
| MA100: | 205.78 | |
| MAexp7: | 214.13 | |
| MAexp20: | 211.25 | |
| MAexp50: | 209.59 | |
| MAexp100: | 204.68 | |
| Price / MA7: | +5.40% | |
| Price / MA20: | +6.74% | |
| Price / MA50: | +6.53% | |
| Price / MA100: | +8.81% | |
| Price / MAexp7: | +4.56% | |
| Price / MAexp20: | +5.99% | |
| Price / MAexp50: | +6.83% | |
| Price / MAexp100: | +9.39% |
News
The latest news and videos published on JP MORGAN CHASE & CO. at the time of the analysis were as follows:
- J.P. Morgan Asset Management Hires Justin Heller to Join Net Lease Strategy for Real Estate Americas
- J.P. Morgan Asset Management Enhances Morgan Money with Expanded Access to Diverse Asset Classes
- EQS-News: Stabilisation Notice
- EQS-News: JPMorgan ETFs (Ireland) ICAV: Dividend Declaration
- J.P. Morgan Asset Management Launches New Active ETF: JPMorgan Dividend Leaders ETF (JDIV)
About author

Online


Add a comment
Comments
0 comments on the analysis JP MORGAN CHASE & CO. - Daily