OBSIDIAN ENERGY LTD. overview
OBSIDIAN ENERGY LTD.
> Analyses

 Thank you
Reply
Chart
Thank you
Reply
Chart
Londinia
has published a new analysis.
- 0
- 93834
- 15800
- 0
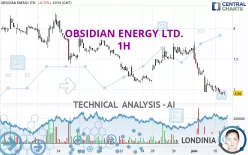
Timeframe : 1H - Simple chart
Status : LEVEL MAINTAINED
We are currently in a phase of short-term indecision. In a case like this, you could favour trades in the direction of the basic trend on OBSIDIAN ENERGY LTD.. As long as you are under the resistance…
OBSIDIAN ENERGY LTD.
> Analyses
 Thank you
Reply
Chart
Thank you
Reply
Chart
Londinia
has published a new analysis.
- 0
- 93834
- 15800
- 0
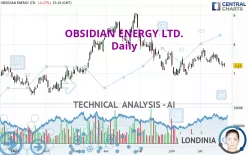
Timeframe : Daily - Simple chart
Status : NEUTRAL
The short-term increase on OBSIDIAN ENERGY LTD. remains moderate but could challenge the slightly bearish basic trend. It is difficult to advise a trading direction under these conditions. The first…
OBSIDIAN ENERGY LTD.
> Analyses
 Thank you
Reply
Chart
Thank you
Reply
Chart
Londinia
has published a new analysis.
- 0
- 93834
- 15800
- 0
Timeframe : 1H - Simple chart
Status : TARGET REACHED
The basic trend is bearish on OBSIDIAN ENERGY LTD. and in the short term, the price is trying to rebound. For the time being, this is only a technical rebound and the basic trend is not threatened. To…
OBSIDIAN ENERGY LTD.
> Analyses
 Thank you
Reply
Chart
Thank you
Reply
Chart
Londinia
has published a new analysis.
- 0
- 93834
- 15800
- 0
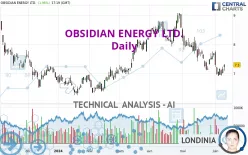
Timeframe : Daily - Simple chart
Status : INVALID
OBSIDIAN ENERGY LTD. is part of a very strong bearish trend. Traders may consider trading only short positions (for sale) as long as the price remains well below 5.52 USD. The next support located at…
OBSIDIAN ENERGY LTD.
> Analyses
 Thank you
Reply
Chart
Thank you
Reply
Chart
Londinia
has published a new analysis.
- 0
- 93834
- 15800
- 0
Timeframe : Daily - Simple chart
Status : TARGET REACHED
In the short term, we can see an acceleration in the bearish trend on OBSIDIAN ENERGY LTD., which is a positive signal for sellers. As long as the price remains above 7.39 USD, a sale could be…
OBSIDIAN ENERGY LTD.
> Analyses
 Thank you
Reply
Chart
Thank you
Reply
Chart
Londinia
has published a new analysis.
- 0
- 93834
- 15800
- 0
Timeframe : Daily - Simple chart
Status : INVALID
OBSIDIAN ENERGY LTD. is part of a very strong bearish trend. Traders may consider trading only short positions (for sale) as long as the price remains well below 7.62 USD. The next support located at…
OBSIDIAN ENERGY LTD.
> Analyses
 Thank you
Reply
Chart
Thank you
Reply
Chart
Londinia
has published a new analysis.
- 0
- 93834
- 15800
- 0
Timeframe : 1H - Simple chart
Status : INVALID
The bearish trend is currently very strong for OBSIDIAN ENERGY LTD.. As long as the price remains below the resistance at 7.14 USD, you could try to take advantage of the bearish rally. The first…
OBSIDIAN ENERGY LTD.
> Analyses
 Thank you
Reply
Chart
Thank you
Reply
Chart
Londinia
has published a new analysis.
- 0
- 93834
- 15800
- 0
Timeframe : Daily - Simple chart
Status : TARGET REACHED
The bullish trend is currently very strong on OBSIDIAN ENERGY LTD.. As long as the price remains above the support at 7.89 USD, you could try to benefit from the boom. The first bullish objective is…

