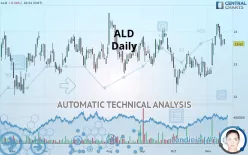
AYVENS - Daily - Technical analysis published on 11/18/2019 (GMT)
- 343
- 0
- Who voted?
Click here for a new analysis!
- Timeframe : Daily
- - Analysis generated on
- Status : TARGET REACHED

Summary of the analysis

Additional analysis
Quotes
The ALD price is 13.62 EUR. On the day, this instrument lost -0.58% with the lowest point at 13.58 EUR and the highest point at 13.76 EUR. The deviation from the price is +0.29% for the low point and -1.02% for the high point.A bullish gap was detected at the opening by the Central Gaps scanner. There are a lot of buyers and they have the upper hand in the very short term.
Opening Gap UP
Type : Bullish
Timeframe : Openning
Here is a more detailed summary of the historical variations registered by ALD:
Near a new HIGH record (1 month)
Type : Bullish
Timeframe : Weekly
Technical
Technical analysis of this Daily chart of ALD indicates that the overall trend is strongly bullish. 85.71% of the signals given by moving averages are bullish. This strongly bullish trend is supported by the strong bullish signals given by short-term moving averages. The Central Indicators market scanner is currently detecting a bullish signal that could impact this trend:
Moving Average bullish crossovers : MA20 & MA50
Type : Bullish
Timeframe : Daily
An assessment of technical indicators shows a moderate bullish signal.
Caution: the Central Indicators scanner currently detects an excess:
Williams %R indicator is overbought : over -20
Type : Neutral
Timeframe : Daily
Price is back under the pivot point
Type : Bearish
Timeframe : Weekly
Central Patterns, the market scanner focusing on chart patterns, resistances and supports found this result:
Near horizontal resistance
Type : Bearish
Timeframe : Daily
Central Candlesticks, the scanner specialised in Japanese candlesticks, detects this inversion signal that could impact the current short-term trend:
Doji
Type : Neutral
Timeframe : Daily
| S3 | S2 | S1 | Price | R1 | R2 | R3 | |
|---|---|---|---|---|---|---|---|
| ProTrendLines | 12.54 | 12.99 | 13.30 | 13.62 | 13.85 | 14.22 | 14.56 |
| Change (%) | -7.93% | -4.63% | -2.35% | - | +1.69% | +4.41% | +6.90% |
| Change | -1.08 | -0.63 | -0.32 | - | +0.23 | +0.60 | +0.94 |
| Level | Major | Intermediate | Intermediate | - | Major | Intermediate | Major |
Attention could also be paid to pivot points to set price objectives:
| Pivot points | S3 | S2 | S1 | PP | R1 | R2 | R3 |
|---|---|---|---|---|---|---|---|
| Standard | 13.45 | 13.51 | 13.61 | 13.67 | 13.77 | 13.83 | 13.93 |
| Camarilla | 13.66 | 13.67 | 13.69 | 13.70 | 13.72 | 13.73 | 13.74 |
| Woodie | 13.46 | 13.52 | 13.62 | 13.68 | 13.78 | 13.84 | 13.94 |
| Fibonacci | 13.51 | 13.57 | 13.61 | 13.67 | 13.73 | 13.77 | 13.83 |
| Pivot points | S3 | S2 | S1 | PP | R1 | R2 | R3 |
|---|---|---|---|---|---|---|---|
| Standard | 12.71 | 13.13 | 13.41 | 13.83 | 14.11 | 14.53 | 14.81 |
| Camarilla | 13.51 | 13.57 | 13.64 | 13.70 | 13.76 | 13.83 | 13.89 |
| Woodie | 12.65 | 13.10 | 13.35 | 13.80 | 14.05 | 14.50 | 14.75 |
| Fibonacci | 13.13 | 13.39 | 13.56 | 13.83 | 14.09 | 14.26 | 14.53 |
| Pivot points | S3 | S2 | S1 | PP | R1 | R2 | R3 |
|---|---|---|---|---|---|---|---|
| Standard | 10.80 | 11.46 | 12.08 | 12.74 | 13.36 | 14.02 | 14.64 |
| Camarilla | 12.35 | 12.47 | 12.58 | 12.70 | 12.82 | 12.94 | 13.05 |
| Woodie | 10.78 | 11.45 | 12.06 | 12.73 | 13.34 | 14.01 | 14.62 |
| Fibonacci | 11.46 | 11.95 | 12.25 | 12.74 | 13.23 | 13.53 | 14.02 |
Numerical data
The following are the details of the technical indicators and moving averages that were collected to generate this technical analysis:
| RSI (14): | 55.37 | |
| MACD (12,26,9): | 0.2000 | |
| Directional Movement: | 10.86 | |
| AROON (14): | 64.29 | |
| DEMA (21): | 13.64 | |
| Parabolic SAR (0,02-0,02-0,2): | 13.49 | |
| Elder Ray (13): | 0.13 | |
| Super Trend (3,10): | 13.15 | |
| Zig ZAG (10): | 13.62 | |
| VORTEX (21): | 1.0700 | |
| Stochastique (14,3,5): | 62.60 | |
| TEMA (21): | 13.84 | |
| Williams %R (14): | -37.80 | |
| Chande Momentum Oscillator (20): | 0.92 | |
| Repulse (5,40,3): | -2.2900 | |
| ROCnROLL: | 1 | |
| TRIX (15,9): | 0.1500 | |
| Courbe Coppock: | 13.87 |
| MA7: | 13.85 | |
| MA20: | 13.26 | |
| MA50: | 13.23 | |
| MA100: | 13.30 | |
| MAexp7: | 13.67 | |
| MAexp20: | 13.42 | |
| MAexp50: | 13.28 | |
| MAexp100: | 13.18 | |
| Price / MA7: | -1.66% | |
| Price / MA20: | +2.71% | |
| Price / MA50: | +2.95% | |
| Price / MA100: | +2.41% | |
| Price / MAexp7: | -0.37% | |
| Price / MAexp20: | +1.49% | |
| Price / MAexp50: | +2.56% | |
| Price / MAexp100: | +3.34% |
News
The latest news and videos published on ALD at the time of the analysis were as follows:
- ALD: Q3 & 9M 2019 Trading Update
- ALD reports First Half 2019 Results
- ALD: Half-year liquidity contract statement
- ALD: Update on the share buyback program
- ALD OFFERING PERSONAL CAR LEASING ON AMAZON.ES
About author

Online


Add a comment
Comments
0 comments on the analysis AYVENS - Daily