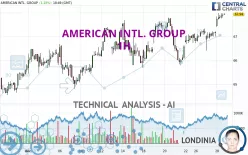
AMERICAN INTL. GROUP - 1H - Technical analysis published on 12/28/2023 (GMT)
- 164
- 0
Click here for a new analysis!
- Timeframe : 1H
- - Analysis generated on
- Status : LEVEL MAINTAINED

Summary of the analysis

Additional analysis
Quotes
AMERICAN INTL. GROUP rating 67.94 USD. The price has increased by +1.18% since the last closing with the lowest point at 67.39 USD and the highest point at 67.97 USD. The deviation from the price is +0.82% for the low point and -0.04% for the high point.A bullish gap was detected at the opening by the Central Gaps scanner. There are a lot of buyers and they have the upper hand in the very short term.
Opening Gap UP
Type : Bullish
Timeframe : Openning
So that you have an overall view of the price change, here is a table showing the variations over several periods:
New HIGH record (5 years)
Type : Bullish
Timeframe : Weekly
New HIGH record (1 year)
Type : Bullish
Timeframe : Weekly
New HIGH record (1st january)
Type : Bullish
Timeframe : Weekly
New HIGH record (1 month)
Type : Bullish
Timeframe : Weekly
Technical
Technical analysis of this 1H chart of AMERICAN INTL. GROUP indicates that the overall trend is strongly bullish. 92.86% of the signals given by moving averages are bullish. The overall trend is supported by the strong bullish signals from short-term moving averages. The Central Indicators market scanner currently does not detect any result that concerns moving averages.
In fact, 16 technical indicators on 18 studied are currently bullish. Caution: the Central Indicators scanner currently detects an excess:
RSI indicator is overbought : over 70
Type : Neutral
Timeframe : 1 hour
CCI indicator is overbought : over 100
Type : Neutral
Timeframe : 1 hour
Williams %R indicator is overbought : over -20
Type : Neutral
Timeframe : 1 hour
Pivot points : price is over resistance 1
Type : Neutral
Timeframe : Weekly
Pivot points : price is over resistance 2
Type : Neutral
Timeframe : 1 hour
An analysis of the price chart with the Central Patterns scanner (detector of chart patterns and resistances and supports) shows several results that can have an impact on the price change:
Near horizontal resistance
Type : Bearish
Timeframe : 1 hour
Resistance of channel is broken
Type : Bullish
Timeframe : 1 hour
No result was found by the Central Candlesticks scanner on Japanese candlesticks.
| S3 | S2 | S1 | Price | R1 | |
|---|---|---|---|---|---|
| ProTrendLines | 64.46 | 66.34 | 67.44 | 67.94 | 1,168.59 |
| Change (%) | -5.12% | -2.36% | -0.74% | - | +1,620.03% |
| Change | -3.48 | -1.60 | -0.50 | - | +1,100.65 |
| Level | Intermediate | Intermediate | Major | - | Intermediate |
To determine price objectives, it is also possible to use the pivot points. Here is the price position in relation to pivot points:
| Pivot points | S3 | S2 | S1 | PP | R1 | R2 | R3 |
|---|---|---|---|---|---|---|---|
| Standard | 65.82 | 66.11 | 66.63 | 66.92 | 67.44 | 67.73 | 68.25 |
| Camarilla | 66.93 | 67.00 | 67.08 | 67.15 | 67.22 | 67.30 | 67.37 |
| Woodie | 65.94 | 66.17 | 66.75 | 66.98 | 67.56 | 67.79 | 68.37 |
| Fibonacci | 66.11 | 66.42 | 66.61 | 66.92 | 67.23 | 67.42 | 67.73 |
| Pivot points | S3 | S2 | S1 | PP | R1 | R2 | R3 |
|---|---|---|---|---|---|---|---|
| Standard | 63.88 | 64.83 | 65.88 | 66.83 | 67.88 | 68.83 | 69.88 |
| Camarilla | 66.38 | 66.56 | 66.75 | 66.93 | 67.11 | 67.30 | 67.48 |
| Woodie | 63.93 | 64.86 | 65.93 | 66.86 | 67.93 | 68.86 | 69.93 |
| Fibonacci | 64.83 | 65.59 | 66.07 | 66.83 | 67.59 | 68.07 | 68.83 |
| Pivot points | S3 | S2 | S1 | PP | R1 | R2 | R3 |
|---|---|---|---|---|---|---|---|
| Standard | 57.97 | 59.47 | 62.47 | 63.97 | 66.97 | 68.47 | 71.47 |
| Camarilla | 64.22 | 64.64 | 65.05 | 65.46 | 65.87 | 66.29 | 66.70 |
| Woodie | 58.71 | 59.85 | 63.21 | 64.35 | 67.71 | 68.85 | 72.21 |
| Fibonacci | 59.47 | 61.19 | 62.25 | 63.97 | 65.69 | 66.75 | 68.47 |
Numerical data
The following are the details of the technical indicators and moving averages that were collected to generate this technical analysis:
| RSI (14): | 71.53 | |
| MACD (12,26,9): | 0.2500 | |
| Directional Movement: | 14.22 | |
| AROON (14): | 57.14 | |
| DEMA (21): | 67.62 | |
| Parabolic SAR (0,02-0,02-0,2): | 66.61 | |
| Elder Ray (13): | 0.39 | |
| Super Trend (3,10): | 67.06 | |
| Zig ZAG (10): | 67.89 | |
| VORTEX (21): | 1.1100 | |
| Stochastique (14,3,5): | 92.17 | |
| TEMA (21): | 67.78 | |
| Williams %R (14): | -4.76 | |
| Chande Momentum Oscillator (20): | 0.77 | |
| Repulse (5,40,3): | 0.4500 | |
| ROCnROLL: | 1 | |
| TRIX (15,9): | 0.0300 | |
| Courbe Coppock: | 1.78 |
| MA7: | 67.11 | |
| MA20: | 66.29 | |
| MA50: | 64.04 | |
| MA100: | 61.81 | |
| MAexp7: | 67.68 | |
| MAexp20: | 67.33 | |
| MAexp50: | 67.02 | |
| MAexp100: | 66.58 | |
| Price / MA7: | +1.24% | |
| Price / MA20: | +2.49% | |
| Price / MA50: | +6.09% | |
| Price / MA100: | +9.92% | |
| Price / MAexp7: | +0.38% | |
| Price / MAexp20: | +0.91% | |
| Price / MAexp50: | +1.37% | |
| Price / MAexp100: | +2.04% |
News
The last news published on AMERICAN INTL. GROUP at the time of the generation of this analysis was as follows:
- AIG Appoints Ed Dandridge as Executive Vice President and Chief Marketing & Communications Officer
- Validus Holdings to Redeem its 8.875% Senior Notes Due 2040
- AIG Reports Second Quarter 2023 Results
- AIG Names Christopher Schaper Global Chief Underwriting Officer
- AIG to Report Second Quarter 2023 Financial Results on August 1, 2023, and Host Conference Call on August 2
About author
Online


Add a comment
Comments
0 comments on the analysis AMERICAN INTL. GROUP - 1H