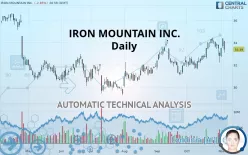
IRON MOUNTAIN INC. - Daily - Technical analysis published on 11/06/2019 (GMT)
- 221
- 0
- Who voted?
Click here for a new analysis!
- Timeframe : Daily
- - Analysis generated on
- Status : INVALID

Summary of the analysis

Additional analysis
Quotes
The IRON MOUNTAIN INC. price is 33.39 USD. The price is lower by -2.85% since the last closing and was traded between 33.08 USD and 34.15 USD over the period. The price is currently at +0.94% from its lowest and -2.23% from its highest.The Central Gaps scanner detects a bullish gap which is a sign that buyers have taken the lead in the very short term.
Opening Gap UP
Type : Bullish
Timeframe : Openning
So that you have an overall view of the price change, here is a table showing the variations over several periods:
Near a new HIGH record (1 year)
Type : Bullish
Timeframe : Weekly
Near a new HIGH record (1st january)
Type : Bullish
Timeframe : Weekly
Technical
Technical analysis of this Daily chart of IRON MOUNTAIN INC. indicates that the overall trend is strongly bullish. 92.86% of the signals given by moving averages are bullish. The overall trend is supported by the strong bullish signals from short-term moving averages. An assessment of moving averages reveals several bullish signals that could impact this trend:
Bullish price crossover with Moving Average 20
Type : Bullish
Timeframe : Daily
Bullish price crossover with adaptative moving average 20
Type : Bullish
Timeframe : Daily
On the 18 technical indicators analysed, 6 are bullish, 8 are neutral and 4 are bearish. Central Indicators, the scanner specialised in technical indicators, has identified these signals:
RSI indicator is back over 50
Type : Bullish
Timeframe : Daily
Price is back over the pivot point
Type : Bullish
Timeframe : Daily
Williams %R indicator is back over -50
Type : Bullish
Timeframe : Daily
An analysis of the price chart with the Central Patterns scanner (detector of chart patterns and resistances and supports) shows a result that can have an impact on the price change:
Near resistance of channel
Type : Bearish
Timeframe : Daily
No result was found by the Central Candlesticks scanner on Japanese candlesticks.
| S3 | S2 | S1 | Price | R1 | R2 | R3 | |
|---|---|---|---|---|---|---|---|
| ProTrendLines | 31.76 | 32.56 | 33.31 | 33.39 | 34.37 | 35.40 | 36.57 |
| Change (%) | -4.88% | -2.49% | -0.24% | - | +2.94% | +6.02% | +9.52% |
| Change | -1.63 | -0.83 | -0.08 | - | +0.98 | +2.01 | +3.18 |
| Level | Intermediate | Major | Major | - | Major | Major | Intermediate |
To determine price objectives, it is also possible to use the pivot points. Here is the price position in relation to pivot points:
| Pivot points | S3 | S2 | S1 | PP | R1 | R2 | R3 |
|---|---|---|---|---|---|---|---|
| Standard | 32.14 | 32.43 | 32.97 | 33.26 | 33.80 | 34.09 | 34.63 |
| Camarilla | 33.29 | 33.37 | 33.44 | 33.52 | 33.60 | 33.67 | 33.75 |
| Woodie | 32.28 | 32.49 | 33.11 | 33.32 | 33.94 | 34.15 | 34.77 |
| Fibonacci | 32.43 | 32.74 | 32.94 | 33.26 | 33.57 | 33.77 | 34.09 |
| Pivot points | S3 | S2 | S1 | PP | R1 | R2 | R3 |
|---|---|---|---|---|---|---|---|
| Standard | 30.57 | 31.38 | 32.45 | 33.26 | 34.33 | 35.14 | 36.21 |
| Camarilla | 33.00 | 33.18 | 33.35 | 33.52 | 33.69 | 33.87 | 34.04 |
| Woodie | 30.70 | 31.45 | 32.58 | 33.33 | 34.46 | 35.21 | 36.34 |
| Fibonacci | 31.38 | 32.10 | 32.54 | 33.26 | 33.98 | 34.42 | 35.14 |
| Pivot points | S3 | S2 | S1 | PP | R1 | R2 | R3 |
|---|---|---|---|---|---|---|---|
| Standard | 28.66 | 30.15 | 31.47 | 32.96 | 34.28 | 35.77 | 37.09 |
| Camarilla | 32.03 | 32.29 | 32.54 | 32.80 | 33.06 | 33.32 | 33.57 |
| Woodie | 28.59 | 30.11 | 31.40 | 32.92 | 34.21 | 35.73 | 37.02 |
| Fibonacci | 30.15 | 31.22 | 31.88 | 32.96 | 34.03 | 34.69 | 35.77 |
Numerical data
The following is the status of technical indicators and moving averages registered at the time this technical analysis was created:
| RSI (14): | 54.20 | |
| MACD (12,26,9): | 0.3500 | |
| Directional Movement: | 7.00 | |
| AROON (14): | -35.71 | |
| DEMA (21): | 33.73 | |
| Parabolic SAR (0,02-0,02-0,2): | 34.23 | |
| Elder Ray (13): | 0.22 | |
| Super Trend (3,10): | 32.64 | |
| Zig ZAG (10): | 33.39 | |
| VORTEX (21): | 1.0500 | |
| Stochastique (14,3,5): | 46.84 | |
| TEMA (21): | 33.73 | |
| Williams %R (14): | -46.67 | |
| Chande Momentum Oscillator (20): | 0.62 | |
| Repulse (5,40,3): | -0.2600 | |
| ROCnROLL: | -1 | |
| TRIX (15,9): | 0.1900 | |
| Courbe Coppock: | 6.45 |
| MA7: | 33.54 | |
| MA20: | 33.19 | |
| MA50: | 32.51 | |
| MA100: | 31.48 | |
| MAexp7: | 33.46 | |
| MAexp20: | 33.23 | |
| MAexp50: | 32.54 | |
| MAexp100: | 32.03 | |
| Price / MA7: | -0.45% | |
| Price / MA20: | +0.60% | |
| Price / MA50: | +2.71% | |
| Price / MA100: | +6.07% | |
| Price / MAexp7: | -0.21% | |
| Price / MAexp20: | +0.48% | |
| Price / MAexp50: | +2.61% | |
| Price / MAexp100: | +4.25% |
News
The last news published on IRON MOUNTAIN INC. at the time of the generation of this analysis was as follows:
- Iron Mountain Reports Fourth Quarter and Full Year 2017 Results
- Iron Mountain Inc. to Host Earnings Call
- Iron Mountain Declares First Quarter 2018 Dividend
- Iron Mountain and Chenega Applied Solutions Awarded Contract by the Federal Bureau of Prisons
- Iron Mountain Incorporated Announces Tax Treatment of 2017 Distributions
About author

Online


Add a comment
Comments
0 comments on the analysis IRON MOUNTAIN INC. - Daily