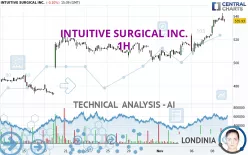
INTUITIVE SURGICAL INC. - 1H - Technical analysis published on 11/11/2024 (GMT)
- 116
- 0
Click here for a new analysis!
- Timeframe : 1H
- - Analysis generated on
- Status : LEVEL MAINTAINED

Summary of the analysis

Additional analysis
Quotes
The INTUITIVE SURGICAL INC. rating is 535.93 USD. The price registered a decrease of -0.10% on the session and was traded between 534.57 USD and 542.59 USD over the period. The price is currently at +0.25% from its lowest and -1.23% from its highest.A bullish gap was detected at the opening by the Central Gaps scanner. There are a lot of buyers and they have the upper hand in the very short term.
Opening Gap UP
Type : Bullish
Timeframe : Openning
So that you have an overall view of the price change, here is a table showing the variations over several periods:
New HIGH record (5 years)
Type : Bullish
Timeframe : Weekly
New HIGH record (1 year)
Type : Bullish
Timeframe : Weekly
New HIGH record (1st january)
Type : Bullish
Timeframe : Weekly
New HIGH record (1 month)
Type : Bullish
Timeframe : Weekly
Technical
A technical analysis in 1H of this INTUITIVE SURGICAL INC. chart shows a strongly bullish trend. 92.86% of the signals given by moving averages are bullish. This strongly bullish trend is supported by the strong bullish signals given by short-term moving averages. There is no crossing of moving average by the price or crossing of moving averages between themselves.
The probability of a further increase is high given the direction of the technical indicators.
But beware of excesses. The Central Indicators scanner currently detects this:
RSI indicator is overbought : over 70
Type : Neutral
Timeframe : 1 hour
The Central Patterns scanner, which studies chart patterns, resistances and supports, has identified this signal:
Near horizontal support
Type : Bullish
Timeframe : 1 hour
For a small rebound in the very short term, the Central Candlesticks scanner currently notes the presence of this bullish pattern in Japanese candlesticks:
Bullish harami cross
Type : Bullish
Timeframe : 1 hour
| S3 | S2 | S1 | Price | |
|---|---|---|---|---|
| ProTrendLines | 494.01 | 507.04 | 521.15 | 535.93 |
| Change (%) | -7.82% | -5.39% | -2.76% | - |
| Change | -41.92 | -28.89 | -14.78 | - |
| Level | Major | Minor | Major | - |
To determine price objectives, it is also possible to use the pivot points. Here is the price position in relation to pivot points:
| Pivot points | S3 | S2 | S1 | PP | R1 | R2 | R3 |
|---|---|---|---|---|---|---|---|
| Standard | 512.98 | 518.49 | 527.47 | 532.98 | 541.96 | 547.47 | 556.45 |
| Camarilla | 532.47 | 533.79 | 535.12 | 536.45 | 537.78 | 539.11 | 540.44 |
| Woodie | 514.72 | 519.36 | 529.21 | 533.85 | 543.70 | 548.34 | 558.19 |
| Fibonacci | 518.49 | 524.03 | 527.45 | 532.98 | 538.52 | 541.94 | 547.47 |
| Pivot points | S3 | S2 | S1 | PP | R1 | R2 | R3 |
|---|---|---|---|---|---|---|---|
| Standard | 479.40 | 491.62 | 514.04 | 526.26 | 548.68 | 560.90 | 583.32 |
| Camarilla | 526.92 | 530.10 | 533.28 | 536.45 | 539.63 | 542.80 | 545.98 |
| Woodie | 484.49 | 494.17 | 519.13 | 528.81 | 553.77 | 563.45 | 588.41 |
| Fibonacci | 491.62 | 504.86 | 513.03 | 526.26 | 539.50 | 547.67 | 560.90 |
| Pivot points | S3 | S2 | S1 | PP | R1 | R2 | R3 |
|---|---|---|---|---|---|---|---|
| Standard | 421.54 | 445.80 | 474.82 | 499.08 | 528.10 | 552.36 | 581.38 |
| Camarilla | 489.19 | 494.07 | 498.96 | 503.84 | 508.72 | 513.61 | 518.49 |
| Woodie | 423.92 | 446.99 | 477.20 | 500.27 | 530.48 | 553.55 | 583.76 |
| Fibonacci | 445.80 | 466.15 | 478.73 | 499.08 | 519.43 | 532.01 | 552.36 |
Numerical data
The following are the details of the technical indicators and moving averages that were collected to generate this technical analysis:
| RSI (14): | 73.84 | |
| MACD (12,26,9): | 6.4600 | |
| Directional Movement: | 33.03 | |
| AROON (14): | 92.86 | |
| DEMA (21): | 534.75 | |
| Parabolic SAR (0,02-0,02-0,2): | 521.68 | |
| Elder Ray (13): | 6.83 | |
| Super Trend (3,10): | 527.11 | |
| Zig ZAG (10): | 536.45 | |
| VORTEX (21): | 1.2300 | |
| Stochastique (14,3,5): | 94.90 | |
| TEMA (21): | 538.53 | |
| Williams %R (14): | -8.90 | |
| Chande Momentum Oscillator (20): | 17.12 | |
| Repulse (5,40,3): | 0.1400 | |
| ROCnROLL: | 1 | |
| TRIX (15,9): | 0.1500 | |
| Courbe Coppock: | 7.50 |
| MA7: | 520.80 | |
| MA20: | 507.97 | |
| MA50: | 493.92 | |
| MA100: | 473.68 | |
| MAexp7: | 535.97 | |
| MAexp20: | 526.92 | |
| MAexp50: | 519.28 | |
| MAexp100: | 513.05 | |
| Price / MA7: | +2.91% | |
| Price / MA20: | +5.50% | |
| Price / MA50: | +8.51% | |
| Price / MA100: | +13.14% | |
| Price / MAexp7: | -0.01% | |
| Price / MAexp20: | +1.71% | |
| Price / MAexp50: | +3.21% | |
| Price / MAexp100: | +4.46% |
News
The last news published on INTUITIVE SURGICAL INC. at the time of the generation of this analysis was as follows:
- Thinking about trading options or stock in Tesla, Meta Platforms, Intuitive Surgical, Bristol-Myers Squibb, or Mind Medicine?
- Thinking about trading options or stock in General Electric, Coinbase Global, Bank of America, Intuitive Surgical, or Scorpio Tankers?
- Thinking about trading options or stock in Intuitive Surgical, Travelers Companies, Dollar General, Pfizer, or Apple?
- Thinking about trading options or stock in ASML Holding, Apple, Hess, Intuitive Surgical, or United Airlines?
- Luna Signs Significant Contract with Intuitive Surgical
About author
Online


Add a comment
Comments
0 comments on the analysis INTUITIVE SURGICAL INC. - 1H