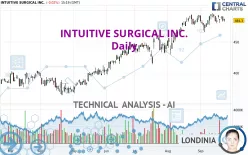
INTUITIVE SURGICAL INC. - Daily - Technical analysis published on 09/25/2024 (GMT)
- 136
- 0
Click here for a new analysis!
- Timeframe : Daily
- - Analysis generated on
- Status : TARGET REACHED

Summary of the analysis

Additional analysis
Quotes
INTUITIVE SURGICAL INC. rating 484.30 USD. The price is lower by -0.02% since the last closing with the lowest point at 482.29 USD and the highest point at 487.12 USD. The deviation from the price is +0.42% for the low point and -0.58% for the high point.A study of price movements over other periods shows the following variations:
Near a new HIGH record (5 years)
Type : Bullish
Timeframe : Weekly
Near a new HIGH record (1 year)
Type : Bullish
Timeframe : Weekly
Near a new HIGH record (1st january)
Type : Bullish
Timeframe : Weekly
Near a new LOW record (1 month)
Type : Bearish
Timeframe : Weekly
Technical
Technical analysis of INTUITIVE SURGICAL INC. in Daily shows a strongly overall bullish trend. 82.14% of the signals given by moving averages are bullish. The slightly bullish signals given by the short-term moving averages show a weakening of the global trend. There is no crossing of moving average by the price or crossing of moving averages between themselves.
In fact, Central Analyzer took into account 18 technical indicators and the result was as follows: 5 are bullish, 10 are neutral and 3 are bearish. Other results related to technical indicators were also found by the Central Indicators scanner:
Price is back under the pivot point
Type : Bearish
Timeframe : Daily
Price is back under the pivot point
Type : Bearish
Timeframe : Weekly
The Central Patterns scanner, which studies chart patterns, resistances and supports, has identified this signal:
Near resistance of channel
Type : Bearish
Timeframe : Daily
The Central Candlesticks scanner which studies Japanese candlesticks did not detect anything.
| S3 | S2 | S1 | Price | R1 | |
|---|---|---|---|---|---|
| ProTrendLines | 400.27 | 444.99 | 471.82 | 484.30 | 493.73 |
| Change (%) | -17.35% | -8.12% | -2.58% | - | +1.95% |
| Change | -84.03 | -39.31 | -12.48 | - | +9.43 |
| Level | Major | Minor | Intermediate | - | Major |
To determine price objectives, it is also possible to use the pivot points. Here is the price position in relation to pivot points:
| Pivot points | S3 | S2 | S1 | PP | R1 | R2 | R3 |
|---|---|---|---|---|---|---|---|
| Standard | 472.84 | 477.59 | 481.00 | 485.75 | 489.16 | 493.91 | 497.32 |
| Camarilla | 482.16 | 482.90 | 483.65 | 484.40 | 485.15 | 485.90 | 486.64 |
| Woodie | 472.16 | 477.26 | 480.32 | 485.42 | 488.48 | 493.58 | 496.64 |
| Fibonacci | 477.59 | 480.71 | 482.64 | 485.75 | 488.87 | 490.80 | 493.91 |
| Pivot points | S3 | S2 | S1 | PP | R1 | R2 | R3 |
|---|---|---|---|---|---|---|---|
| Standard | 464.75 | 472.17 | 479.18 | 486.60 | 493.61 | 501.03 | 508.04 |
| Camarilla | 482.23 | 483.56 | 484.88 | 486.20 | 487.52 | 488.85 | 490.17 |
| Woodie | 464.56 | 472.07 | 478.99 | 486.50 | 493.42 | 500.93 | 507.85 |
| Fibonacci | 472.17 | 477.68 | 481.08 | 486.60 | 492.11 | 495.51 | 501.03 |
| Pivot points | S3 | S2 | S1 | PP | R1 | R2 | R3 |
|---|---|---|---|---|---|---|---|
| Standard | 385.79 | 407.70 | 450.16 | 472.07 | 514.53 | 536.44 | 578.90 |
| Camarilla | 474.93 | 480.83 | 486.73 | 492.63 | 498.53 | 504.43 | 510.33 |
| Woodie | 396.08 | 412.84 | 460.45 | 477.21 | 524.82 | 541.58 | 589.19 |
| Fibonacci | 407.70 | 432.29 | 447.48 | 472.07 | 496.66 | 511.85 | 536.44 |
Numerical data
The following is the status of the technical indicators and moving averages at the time of publication of this technical analysis:
| RSI (14): | 52.10 | |
| MACD (12,26,9): | 4.0700 | |
| Directional Movement: | -1.42 | |
| AROON (14): | 35.72 | |
| DEMA (21): | 490.22 | |
| Parabolic SAR (0,02-0,02-0,2): | 478.77 | |
| Elder Ray (13): | -0.78 | |
| Super Trend (3,10): | 464.00 | |
| Zig ZAG (10): | 483.63 | |
| VORTEX (21): | 0.9700 | |
| Stochastique (14,3,5): | 65.14 | |
| TEMA (21): | 486.92 | |
| Williams %R (14): | -42.18 | |
| Chande Momentum Oscillator (20): | 4.06 | |
| Repulse (5,40,3): | -1.5900 | |
| ROCnROLL: | -1 | |
| TRIX (15,9): | 0.1700 | |
| Courbe Coppock: | 1.73 |
| MA7: | 485.53 | |
| MA20: | 485.21 | |
| MA50: | 469.80 | |
| MA100: | 443.26 | |
| MAexp7: | 485.80 | |
| MAexp20: | 483.75 | |
| MAexp50: | 470.41 | |
| MAexp100: | 447.08 | |
| Price / MA7: | -0.25% | |
| Price / MA20: | -0.19% | |
| Price / MA50: | +3.09% | |
| Price / MA100: | +9.26% | |
| Price / MAexp7: | -0.31% | |
| Price / MAexp20: | +0.11% | |
| Price / MAexp50: | +2.95% | |
| Price / MAexp100: | +8.33% |
News
The latest news and videos published on INTUITIVE SURGICAL INC. at the time of the analysis were as follows:
- Thinking about trading options or stock in Tesla, Meta Platforms, Intuitive Surgical, Bristol-Myers Squibb, or Mind Medicine?
- Thinking about trading options or stock in General Electric, Coinbase Global, Bank of America, Intuitive Surgical, or Scorpio Tankers?
- Thinking about trading options or stock in Intuitive Surgical, Travelers Companies, Dollar General, Pfizer, or Apple?
- Thinking about trading options or stock in ASML Holding, Apple, Hess, Intuitive Surgical, or United Airlines?
- Luna Signs Significant Contract with Intuitive Surgical
About author
Online


Add a comment
Comments
0 comments on the analysis INTUITIVE SURGICAL INC. - Daily