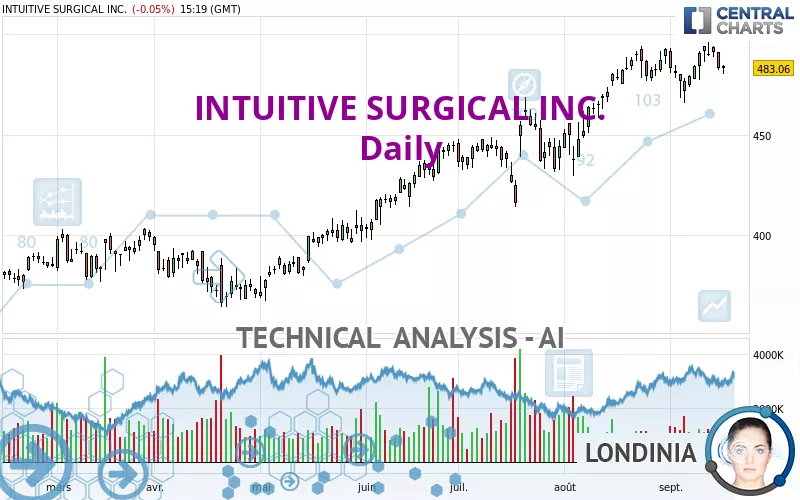
INTUITIVE SURGICAL INC. - Daily - Technical analysis published on 09/18/2024 (GMT)
- 131
- 0
Click here for a new analysis!
- Timeframe : Daily
- - Analysis generated on
- Status : TARGET REACHED
Summary of the analysis

Additional analysis
Quotes
The INTUITIVE SURGICAL INC. price is 483.05 USD. The price is lower by -0.06% since the last closing and was between 480.36 USD and 484.75 USD. This implies that the price is at +0.56% from its lowest and at -0.35% from its highest.A study of price movements over other periods shows the following variations:
Near a new HIGH record (5 years)
Type : Bullish
Timeframe : Weekly
Near a new HIGH record (1 year)
Type : Bullish
Timeframe : Weekly
Near a new HIGH record (1st january)
Type : Bullish
Timeframe : Weekly
Near a new LOW record (1 month)
Type : Bearish
Timeframe : Weekly
Technical
A technical analysis in Daily of this INTUITIVE SURGICAL INC. chart shows a strongly bullish trend. The signals given by moving averages are 85.71% bullish. This strongly bullish trend seems to be running out of steam given the signals being given by short-term moving averages. The Central Indicators market scanner currently does not detect any result that concerns moving averages.
In fact, of the 18 technical indicators analysed by Central Analyzer, 5 are bullish, 9 are neutral and 4 are bearish. Central Indicators, the detector scanner for these technical indicators recently detected a signal:
Price is back under the pivot point
Type : Bearish
Timeframe : Weekly
An analysis of the price chart with the Central Patterns scanner (detector of chart patterns and resistances and supports) shows a result that can have an impact on the price change:
Near support of channel
Type : Bullish
Timeframe : Daily
The Central Candlesticks scanner, specialised in Japanese candlesticks, did not identify any signals.
| S3 | S2 | S1 | Price | R1 | |
|---|---|---|---|---|---|
| ProTrendLines | 400.27 | 444.99 | 471.82 | 483.05 | 492.39 |
| Change (%) | -17.14% | -7.88% | -2.32% | - | +1.93% |
| Change | -82.78 | -38.06 | -11.23 | - | +9.34 |
| Level | Major | Minor | Minor | - | Major |
Pivot points can also be used to set your price objectives. Here is the price situation in relation to pivot points:
| Pivot points | S3 | S2 | S1 | PP | R1 | R2 | R3 |
|---|---|---|---|---|---|---|---|
| Standard | 471.15 | 476.77 | 480.04 | 485.66 | 488.93 | 494.55 | 497.82 |
| Camarilla | 480.88 | 481.69 | 482.51 | 483.32 | 484.14 | 484.95 | 485.77 |
| Woodie | 469.99 | 476.18 | 478.88 | 485.07 | 487.77 | 493.96 | 496.66 |
| Fibonacci | 476.77 | 480.16 | 482.26 | 485.66 | 489.05 | 491.15 | 494.55 |
| Pivot points | S3 | S2 | S1 | PP | R1 | R2 | R3 |
|---|---|---|---|---|---|---|---|
| Standard | 454.97 | 464.47 | 477.17 | 486.67 | 499.37 | 508.87 | 521.57 |
| Camarilla | 483.76 | 485.79 | 487.83 | 489.86 | 491.90 | 493.93 | 495.97 |
| Woodie | 456.56 | 465.27 | 478.76 | 487.47 | 500.96 | 509.67 | 523.16 |
| Fibonacci | 464.47 | 472.95 | 478.19 | 486.67 | 495.15 | 500.39 | 508.87 |
| Pivot points | S3 | S2 | S1 | PP | R1 | R2 | R3 |
|---|---|---|---|---|---|---|---|
| Standard | 385.79 | 407.70 | 450.16 | 472.07 | 514.53 | 536.44 | 578.90 |
| Camarilla | 474.93 | 480.83 | 486.73 | 492.63 | 498.53 | 504.43 | 510.33 |
| Woodie | 396.08 | 412.84 | 460.45 | 477.21 | 524.82 | 541.58 | 589.19 |
| Fibonacci | 407.70 | 432.29 | 447.48 | 472.07 | 496.66 | 511.85 | 536.44 |
Numerical data
The following are the details of the technical indicators and moving averages that were collected to generate this technical analysis:
| RSI (14): | 53.95 | |
| MACD (12,26,9): | 5.7700 | |
| Directional Movement: | 0.22 | |
| AROON (14): | 35.71 | |
| DEMA (21): | 490.85 | |
| Parabolic SAR (0,02-0,02-0,2): | 472.46 | |
| Elder Ray (13): | -2.31 | |
| Super Trend (3,10): | 464.00 | |
| Zig ZAG (10): | 483.61 | |
| VORTEX (21): | 1.0100 | |
| Stochastique (14,3,5): | 66.62 | |
| TEMA (21): | 488.47 | |
| Williams %R (14): | -41.65 | |
| Chande Momentum Oscillator (20): | -9.02 | |
| Repulse (5,40,3): | -0.7100 | |
| ROCnROLL: | -1 | |
| TRIX (15,9): | 0.2200 | |
| Courbe Coppock: | 0.82 |
| MA7: | 488.17 | |
| MA20: | 484.92 | |
| MA50: | 465.31 | |
| MA100: | 437.64 | |
| MAexp7: | 486.03 | |
| MAexp20: | 482.21 | |
| MAexp50: | 466.90 | |
| MAexp100: | 443.09 | |
| Price / MA7: | -1.05% | |
| Price / MA20: | -0.39% | |
| Price / MA50: | +3.81% | |
| Price / MA100: | +10.38% | |
| Price / MAexp7: | -0.61% | |
| Price / MAexp20: | +0.17% | |
| Price / MAexp50: | +3.46% | |
| Price / MAexp100: | +9.02% |
News
The latest news and videos published on INTUITIVE SURGICAL INC. at the time of the analysis were as follows:
- Thinking about trading options or stock in Tesla, Meta Platforms, Intuitive Surgical, Bristol-Myers Squibb, or Mind Medicine?
- Thinking about trading options or stock in General Electric, Coinbase Global, Bank of America, Intuitive Surgical, or Scorpio Tankers?
- Thinking about trading options or stock in Intuitive Surgical, Travelers Companies, Dollar General, Pfizer, or Apple?
- Thinking about trading options or stock in ASML Holding, Apple, Hess, Intuitive Surgical, or United Airlines?
- Luna Signs Significant Contract with Intuitive Surgical
About author
Online


Add a comment
Comments
0 comments on the analysis INTUITIVE SURGICAL INC. - Daily