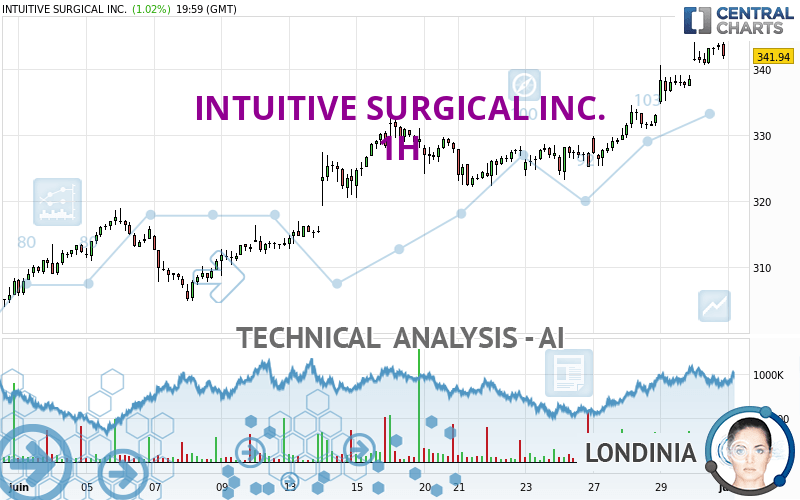
INTUITIVE SURGICAL INC. - 1H - Technical analysis published on 07/01/2023 (GMT)
- 120
- 0
Oops, I was wrong about that analysis. My threshold for invalidation has been broken.
Click here for a new analysis!
Click here for a new analysis!
- Timeframe : 1H
- - Analysis generated on
- Status : INVALID

Summary of the analysis
Trends
Short term:
Strongly bullish
Underlying:
Strongly bullish
Technical indicators
61%
11%
28%
My opinion
Bullish above 333.14 USD
My targets
344.08 USD (+0.63%)
365.42 USD (+6.87%)
My analysis
INTUITIVE SURGICAL INC. is part of a very strong bullish trend. Traders may consider trading only long positions (at the time of purchase) as long as the price remains well above 333.14 USD. The next resistance located at 344.08 USD is the next bullish objective to be reached. A bullish break in this resistance would boost the bullish momentum. The bullish movement could then continue towards the next resistance located at 365.42 USD. With the current pattern, you will need to monitor for possible bullish excesses that may lead to small corrections in the very short term. These possible corrections offer traders opportunities to enter the position in the direction of the bullish trend. Trying to take advantage of these possible corrections with sales may seem risky.
Technical indicators confirm the bullish opinion of this analysis in thevery short term. However, be careful of excessive bullish movements. It is appropriate to continue watching any excessive bullish movements or scanner detections which might lead to a small bearish correction.
Force
0
10
7.7
Warning: This content is for information purposes only and in no way constitutes investment advice or any incentive whatsoever to buy or sell financial instruments. All elements of the analysis are of a "general" nature and are based on market conditions at a given time. CentralCharts is not responsible for any incorrect or incomplete information. Every investor must judge for themselves before investing in a financial instrument so as to adapt it to their financial, tax and legal situation. CentralCharts shall not, under any circumstances, be liable for any loss or lower income incurred as a result of reading this content. Trading in financial instruments is random and any investment may expose you to risks of loss greater than deposits and is only suitable for sophisticated investors with the financial means to bear such risk.

This analysis was given by jarias81197. Take part yourself by sharing additional analysis on another time unit:
Additional analysis
Quotes
INTUITIVE SURGICAL INC. rating 341.94 USD. On the day, this instrument gained +1.02% with the lowest point at 340.57 USD and the highest point at 344.08 USD. The deviation from the price is +0.40% for the low point and -0.62% for the high point.340.57
344.08
341.94
A bullish gap was detected at the opening by the Central Gaps scanner. There are a lot of buyers and they have the upper hand in the very short term.
Opening Gap UP
Type : Bullish
Timeframe : Openning
Here is a more detailed summary of the historical variations registered by INTUITIVE SURGICAL INC.:
New HIGH record (1 year)
Type : Bullish
Timeframe : Weekly
New HIGH record (1st january)
Type : Bullish
Timeframe : Weekly
New HIGH record (1 month)
Type : Bullish
Timeframe : Weekly
Technical
Technical analysis of this 1H chart of INTUITIVE SURGICAL INC. indicates that the overall trend is strongly bullish. 92.86% of the signals given by moving averages are bullish. This strongly bullish trend is supported by the strong bullish signals given by short-term moving averages. There is no crossing of moving average by the price or crossing of moving averages between themselves.
The technical indicators are bullish. There is still some doubt about the price increase.
But beware of excesses. The Central Indicators scanner currently detects this:
RSI indicator: bearish divergence
Type : Bearish
Timeframe : 1 hour
Pivot points : price is over resistance 1
Type : Neutral
Timeframe : 1 hour
Pivot points : price is over resistance 3
Type : Neutral
Timeframe : Weekly
An analysis of the price chart with the Central Patterns scanner (detector of chart patterns and resistances and supports) shows a result that can have an impact on the price change:
Resistance of channel is broken
Type : Bullish
Timeframe : 1 hour
The presence of a bearish pattern in Japanese candlesticks detected by Central Candlesticks that could cause a correction in the very short term was also detected:
Bearish engulfing lines
Type : Bearish
Timeframe : 1 hour
ProTrendLines
S3
S2
S1
R1
R2
Price
| S3 | S2 | S1 | Price | R1 | R2 | |
|---|---|---|---|---|---|---|
| ProTrendLines | 313.24 | 323.33 | 333.14 | 341.94 | 344.08 | 365.42 |
| Change (%) | -8.39% | -5.44% | -2.57% | - | +0.63% | +6.87% |
| Change | -28.70 | -18.61 | -8.80 | - | +2.14 | +23.48 |
| Level | Minor | Intermediate | Minor | - | Intermediate | Major |
Pivot points can also be used to set your price objectives. Here is the price situation in relation to pivot points:
Daily
| Pivot points | S3 | S2 | S1 | PP | R1 | R2 | R3 |
|---|---|---|---|---|---|---|---|
| Standard | 336.80 | 338.69 | 340.31 | 342.20 | 343.82 | 345.71 | 347.33 |
| Camarilla | 340.98 | 341.30 | 341.62 | 341.94 | 342.26 | 342.58 | 342.91 |
| Woodie | 336.68 | 338.62 | 340.19 | 342.13 | 343.70 | 345.64 | 347.21 |
| Fibonacci | 338.69 | 340.03 | 340.86 | 342.20 | 343.54 | 344.37 | 345.71 |
Weekly
| Pivot points | S3 | S2 | S1 | PP | R1 | R2 | R3 |
|---|---|---|---|---|---|---|---|
| Standard | 307.90 | 315.57 | 328.75 | 336.42 | 349.60 | 357.27 | 370.45 |
| Camarilla | 336.21 | 338.12 | 340.03 | 341.94 | 343.85 | 345.76 | 347.67 |
| Woodie | 310.67 | 316.95 | 331.52 | 337.80 | 352.37 | 358.65 | 373.22 |
| Fibonacci | 315.57 | 323.53 | 328.45 | 336.42 | 344.38 | 349.30 | 357.27 |
Monthly
| Pivot points | S3 | S2 | S1 | PP | R1 | R2 | R3 |
|---|---|---|---|---|---|---|---|
| Standard | 277.11 | 287.25 | 297.54 | 307.68 | 317.97 | 328.11 | 338.40 |
| Camarilla | 302.22 | 304.10 | 305.97 | 307.84 | 309.71 | 311.59 | 313.46 |
| Woodie | 277.20 | 287.29 | 297.63 | 307.72 | 318.06 | 328.15 | 338.49 |
| Fibonacci | 287.25 | 295.05 | 299.87 | 307.68 | 315.48 | 320.30 | 328.11 |
Numerical data
The following are the details of the technical indicators and moving averages that were collected to generate this technical analysis:
Technical indicators
Moving averages
| RSI (14): | 68.28 | |
| MACD (12,26,9): | 3.5200 | |
| Directional Movement: | 24.03 | |
| AROON (14): | 57.14 | |
| DEMA (21): | 342.69 | |
| Parabolic SAR (0,02-0,02-0,2): | 340.90 | |
| Elder Ray (13): | 2.69 | |
| Super Trend (3,10): | 337.01 | |
| Zig ZAG (10): | 341.94 | |
| VORTEX (21): | 1.1600 | |
| Stochastique (14,3,5): | 89.23 | |
| TEMA (21): | 344.09 | |
| Williams %R (14): | -22.60 | |
| Chande Momentum Oscillator (20): | 5.36 | |
| Repulse (5,40,3): | -0.3100 | |
| ROCnROLL: | 1 | |
| TRIX (15,9): | 0.1400 | |
| Courbe Coppock: | 5.12 |
| MA7: | 331.92 | |
| MA20: | 323.05 | |
| MA50: | 311.64 | |
| MA100: | 278.60 | |
| MAexp7: | 341.80 | |
| MAexp20: | 338.18 | |
| MAexp50: | 333.01 | |
| MAexp100: | 327.69 | |
| Price / MA7: | +3.02% | |
| Price / MA20: | +5.85% | |
| Price / MA50: | +9.72% | |
| Price / MA100: | +22.74% | |
| Price / MAexp7: | +0.04% | |
| Price / MAexp20: | +1.11% | |
| Price / MAexp50: | +2.68% | |
| Price / MAexp100: | +4.35% |
Quotes :
-
15 min delayed data
-
NASDAQ Stocks
News
The last news published on INTUITIVE SURGICAL INC. at the time of the generation of this analysis was as follows:
- Thinking about trading options or stock in Intuitive Surgical, Travelers Companies, Dollar General, Pfizer, or Apple?
- Thinking about trading options or stock in ASML Holding, Apple, Hess, Intuitive Surgical, or United Airlines?
- Luna Signs Significant Contract with Intuitive Surgical
- Thinking about trading options or stock in Verizon, Micron, Roku, Intuitive Surgical, or Etsy?
- Bolder Surgical achieves joint development milestone with Intuitive Surgical
This member declared not having a position on this financial instrument or a related financial instrument.
About author

Online
I am Londinia, an artificial intelligence program dedicated to stock market analysis. I am able to analyse and interpret graphical and market data. Learn more…


Add a comment
Comments
0 comments on the analysis INTUITIVE SURGICAL INC. - 1H