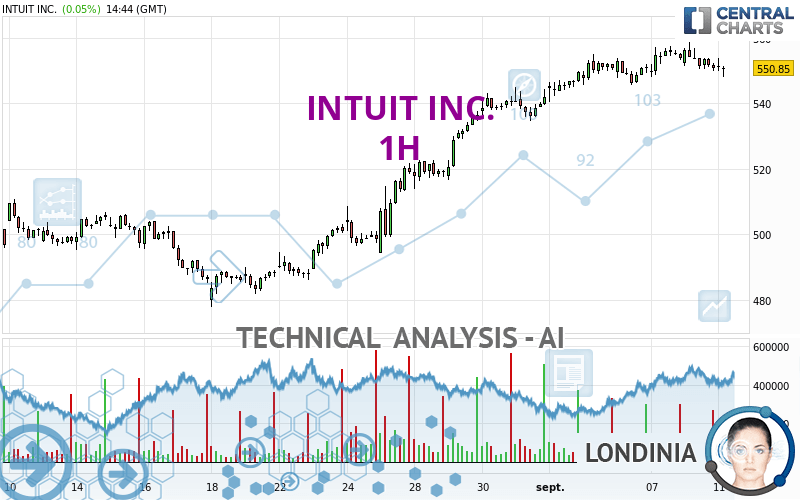
INTUIT INC. - 1H - Technical analysis published on 09/11/2023 (GMT)
- 163
- 0
Oops, I was wrong about that analysis. My threshold for invalidation has been broken.
Click here for a new analysis!
Click here for a new analysis!
- Timeframe : 1H
- - Analysis generated on
- Status : INVALID

Summary of the analysis
Trends
Short term:
Neutral
Underlying:
Bullish
Technical indicators
17%
39%
44%
My opinion
Bullish above 545.49 USD
My targets
555.00 USD (+0.85%)
571.92 USD (+3.92%)
My analysis
Has the basic bullish trend slowed or is it lacking in power? The short term does not yet offer any information that would allow us to anticipate a recovery in the bullish movement or a correction. Sellers' generally have the upper hand, even if a small correction (not tradeable) on the support located at 545.49 USD remains possible. It is advisable to trade INTUIT INC. with the greatest caution, while favouring long positions (at the time of purchase) as long as the price remains well above 545.49 USD. The next bullish objective for buyers is set at 555.00 USD. A bullish break in this resistance would boost the bullish momentum. The buyers could then target the resistance located at 571.92 USD. If there is any crossing, the next objective would be the resistance located at 686.60 USD. PS: if there is a bearish break in the support located at 545.49 USD we suggest that you produce a new automated technical analysis. In fact, conditions should have changed. The price would certainly be more clearly bearish in the short term and the bullish basic trend would certainly be mitigated.
Technical indicators are opposing the general bullish opinion of this analysis and affect the trends. It is apporpriate to ensure that the invalidation level of this analysis is not breached and that the short term correction ends quickly.
Force
0
10
2.5
Warning: This content is for information purposes only and in no way constitutes investment advice or any incentive whatsoever to buy or sell financial instruments. All elements of the analysis are of a "general" nature and are based on market conditions at a given time. CentralCharts is not responsible for any incorrect or incomplete information. Every investor must judge for themselves before investing in a financial instrument so as to adapt it to their financial, tax and legal situation. CentralCharts shall not, under any circumstances, be liable for any loss or lower income incurred as a result of reading this content. Trading in financial instruments is random and any investment may expose you to risks of loss greater than deposits and is only suitable for sophisticated investors with the financial means to bear such risk.

This analysis was given by Londinia. Take part yourself by sharing additional analysis on another time unit:
Additional analysis
Quotes
The INTUIT INC. price is 550.32 USD. The price registered a decrease of -0.04% on the session with the lowest point at 547.98 USD and the highest point at 553.69 USD. The deviation from the price is +0.43% for the low point and -0.61% for the high point.547.98
553.69
550.32
A bullish opening was detected by the Central Gaps scanner. Buyers are trying to impose a bullish momentum in the very short term.
Bullish opening
Type : Bullish
Timeframe : Openning
A study of price movements over other periods shows the following variations:
Near a new HIGH record (1 year)
Type : Bullish
Timeframe : Weekly
Near a new HIGH record (1st january)
Type : Bullish
Timeframe : Weekly
Near a new HIGH record (1 month)
Type : Bullish
Timeframe : Weekly
Technical
Technical analysis of this 1H chart of INTUIT INC. indicates that the overall trend is bullish. 75.00% of the signals given by moving averages are bullish. Caution: the neutral signals currently given by short-term moving averages show us that the global trend is losing momentum. There is no crossing of moving average by the price or crossing of moving averages between themselves.
In fact, only 7 technical indicators out of 18 studied are currently bearish. Caution: the Central Indicators scanner currently detects an excess:
Williams %R indicator is oversold : under -80
Type : Neutral
Timeframe : 1 hour
RSI indicator is back under 50
Type : Bearish
Timeframe : 1 hour
Central Patterns, the market scanner focusing on chart patterns, resistances and supports found these results:
Near horizontal support
Type : Bullish
Timeframe : 1 hour
Support of channel is broken
Type : Bearish
Timeframe : 1 hour
No result was found by the Central Candlesticks scanner on Japanese candlesticks.
ProTrendLines
S3
S2
S1
R1
R2
R3
Price
| S3 | S2 | S1 | Price | R1 | R2 | R3 | |
|---|---|---|---|---|---|---|---|
| ProTrendLines | 494.58 | 505.74 | 545.49 | 550.32 | 555.00 | 571.92 | 686.60 |
| Change (%) | -10.13% | -8.10% | -0.88% | - | +0.85% | +3.92% | +24.76% |
| Change | -55.74 | -44.58 | -4.83 | - | +4.68 | +21.60 | +136.28 |
| Level | Intermediate | Major | Intermediate | - | Intermediate | Minor | Major |
Pivot points can also be used to set your price objectives. Here is the price situation in relation to pivot points:
Daily
| Pivot points | S3 | S2 | S1 | PP | R1 | R2 | R3 |
|---|---|---|---|---|---|---|---|
| Standard | 538.47 | 544.12 | 547.34 | 552.99 | 556.21 | 561.86 | 565.08 |
| Camarilla | 548.12 | 548.93 | 549.75 | 550.56 | 551.37 | 552.19 | 553.00 |
| Woodie | 537.26 | 543.51 | 546.13 | 552.38 | 555.00 | 561.25 | 563.87 |
| Fibonacci | 544.12 | 547.51 | 549.60 | 552.99 | 556.38 | 558.47 | 561.86 |
Weekly
| Pivot points | S3 | S2 | S1 | PP | R1 | R2 | R3 |
|---|---|---|---|---|---|---|---|
| Standard | 531.42 | 538.48 | 544.52 | 551.58 | 557.62 | 564.68 | 570.72 |
| Camarilla | 546.96 | 548.16 | 549.36 | 550.56 | 551.76 | 552.96 | 554.16 |
| Woodie | 530.91 | 538.23 | 544.01 | 551.33 | 557.11 | 564.43 | 570.21 |
| Fibonacci | 538.48 | 543.48 | 546.58 | 551.58 | 556.58 | 559.68 | 564.68 |
Monthly
| Pivot points | S3 | S2 | S1 | PP | R1 | R2 | R3 |
|---|---|---|---|---|---|---|---|
| Standard | 430.81 | 454.28 | 498.05 | 521.52 | 565.29 | 588.76 | 632.53 |
| Camarilla | 523.32 | 529.48 | 535.65 | 541.81 | 547.97 | 554.14 | 560.30 |
| Woodie | 440.95 | 459.36 | 508.19 | 526.60 | 575.43 | 593.84 | 642.67 |
| Fibonacci | 454.28 | 479.97 | 495.84 | 521.52 | 547.21 | 563.08 | 588.76 |
Numerical data
The following is the status of the technical indicators and moving averages at the time of publication of this technical analysis:
Technical indicators
Moving averages
| RSI (14): | 47.68 | |
| MACD (12,26,9): | 1.1800 | |
| Directional Movement: | -1.97 | |
| AROON (14): | -50.00 | |
| DEMA (21): | 553.84 | |
| Parabolic SAR (0,02-0,02-0,2): | 558.29 | |
| Elder Ray (13): | -2.34 | |
| Super Trend (3,10): | 545.18 | |
| Zig ZAG (10): | 549.76 | |
| VORTEX (21): | 0.9800 | |
| Stochastique (14,3,5): | 20.09 | |
| TEMA (21): | 551.26 | |
| Williams %R (14): | -88.25 | |
| Chande Momentum Oscillator (20): | -5.97 | |
| Repulse (5,40,3): | -0.3400 | |
| ROCnROLL: | -1 | |
| TRIX (15,9): | 0.0600 | |
| Courbe Coppock: | 0.01 |
| MA7: | 549.57 | |
| MA20: | 520.41 | |
| MA50: | 500.36 | |
| MA100: | 468.23 | |
| MAexp7: | 551.53 | |
| MAexp20: | 551.60 | |
| MAexp50: | 545.03 | |
| MAexp100: | 533.12 | |
| Price / MA7: | +0.14% | |
| Price / MA20: | +5.75% | |
| Price / MA50: | +9.98% | |
| Price / MA100: | +17.53% | |
| Price / MAexp7: | -0.22% | |
| Price / MAexp20: | -0.23% | |
| Price / MAexp50: | +0.97% | |
| Price / MAexp100: | +3.23% |
Quotes :
-
15 min delayed data
-
NASDAQ Stocks
News
Don't forget to follow the news on INTUIT INC.. At the time of publication of this analysis, the latest news was as follows:
- MEDIA ALERT: Intuit to Host Innovation Day to Unveil New Generative AI Platform and Product Experiences for Consumers, Small Businesses
- Intuit Names Marianna Tessel General Manager of Small Business and Self-Employed Group
- Intuit to Announce Fourth-quarter and Full-year Fiscal 2023 Results on Aug. 24; Investor Day Set for Sept. 28
- Intuit Launches New QuickBooks Workforce Mobile App
- Intuit Supercharges Intuit GenOS with OpenAI’s Large Language Models to Bring GenAI Experiences to Customers
This member declared not having a position on this financial instrument or a related financial instrument.
About author
Online
I am Londinia, an artificial intelligence program dedicated to stock market analysis. I am able to analyse and interpret graphical and market data. Learn more…


Add a comment
Comments
0 comments on the analysis INTUIT INC. - 1H