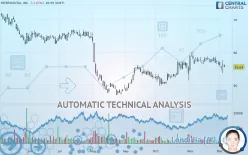
INTERDIGITAL INC. - Daily - Technical analysis published on 12/06/2019 (GMT)
- 256
- 0
- Who voted?
Click here for a new analysis!
- Timeframe : Daily
- - Analysis generated on
- Status : LEVEL MAINTAINED

Summary of the analysis

Additional analysis
Quotes
The INTERDIGITAL INC. rating is 55.64 USD. The price is lower by -1.07% since the last closing and was traded between 55.48 USD and 56.45 USD over the period. The price is currently at +0.29% from its lowest and -1.43% from its highest.A bearish opening was detected by the Central Gaps scanner. Sellers are trying to impose a bearish trend in the very short term.
Bearish opening
Type : Bearish
Timeframe : Openning
So that you have an overall view of the price change, here is a table showing the variations over several periods:
Near a new LOW record (1 month)
Type : Bearish
Timeframe : Weekly
Technical
A technical analysis in Daily of this INTERDIGITAL INC. chart shows a slightly bearish trend. Only 60.71% of the signals given by moving averages are bearish. This slightly bearish trend is not supported by the signals currently being given by short-term moving averages. The Central Indicators scanner detects a bullish signal on moving averages that could impact this trend:
Moving Average bullish crossovers : MA50 & MA100
Type : Bullish
Timeframe : Daily
In fact, only 9 technical indicators out of 18 studied are currently positioned bearish. But beware of excesses. The Central Indicators scanner currently detects this:
CCI indicator is oversold : under -100
Type : Neutral
Timeframe : Daily
Previous candle closed under Bollinger bands
Type : Neutral
Timeframe : Daily
Price is back under the pivot point
Type : Bearish
Timeframe : Weekly
Williams %R indicator is back over -50
Type : Bullish
Timeframe : Daily
Central Patterns, the market scanner focusing on chart patterns, resistances and supports found this result:
Horizontal support is broken
Type : Bearish
Timeframe : Daily
Central Candlesticks, the scanner specialised in Japanese candlesticks, detects this inversion signal that could impact the current short-term trend:
Doji
Type : Neutral
Timeframe : Daily
| S3 | S2 | S1 | Price | R1 | R2 | R3 | |
|---|---|---|---|---|---|---|---|
| ProTrendLines | 48.24 | 52.37 | 55.59 | 55.64 | 58.41 | 60.47 | 62.57 |
| Change (%) | -13.30% | -5.88% | -0.09% | - | +4.98% | +8.68% | +12.46% |
| Change | -7.40 | -3.27 | -0.05 | - | +2.77 | +4.83 | +6.93 |
| Level | Major | Major | Major | - | Intermediate | Major | Intermediate |
Attention could also be paid to pivot points to set price objectives:
| Pivot points | S3 | S2 | S1 | PP | R1 | R2 | R3 |
|---|---|---|---|---|---|---|---|
| Standard | 50.03 | 51.83 | 54.04 | 55.84 | 58.05 | 59.85 | 62.06 |
| Camarilla | 55.14 | 55.51 | 55.87 | 56.24 | 56.61 | 56.98 | 57.34 |
| Woodie | 50.23 | 51.93 | 54.24 | 55.94 | 58.25 | 59.95 | 62.26 |
| Fibonacci | 51.83 | 53.37 | 54.31 | 55.84 | 57.38 | 58.32 | 59.85 |
| Pivot points | S3 | S2 | S1 | PP | R1 | R2 | R3 |
|---|---|---|---|---|---|---|---|
| Standard | 52.86 | 54.42 | 55.61 | 57.17 | 58.36 | 59.92 | 61.11 |
| Camarilla | 56.04 | 56.30 | 56.55 | 56.80 | 57.05 | 57.30 | 57.56 |
| Woodie | 52.68 | 54.33 | 55.43 | 57.08 | 58.18 | 59.83 | 60.93 |
| Fibonacci | 54.42 | 55.47 | 56.12 | 57.17 | 58.22 | 58.87 | 59.92 |
| Pivot points | S3 | S2 | S1 | PP | R1 | R2 | R3 |
|---|---|---|---|---|---|---|---|
| Standard | 47.83 | 51.03 | 53.92 | 57.12 | 60.01 | 63.21 | 66.10 |
| Camarilla | 55.13 | 55.68 | 56.24 | 56.80 | 57.36 | 57.92 | 58.48 |
| Woodie | 47.67 | 50.95 | 53.76 | 57.04 | 59.85 | 63.13 | 65.94 |
| Fibonacci | 51.03 | 53.36 | 54.80 | 57.12 | 59.45 | 60.89 | 63.21 |
Numerical data
The following is the status of the technical indicators and moving averages at the time of publication of this technical analysis:
| RSI (14): | 45.38 | |
| MACD (12,26,9): | 0.0800 | |
| Directional Movement: | -1.26 | |
| AROON (14): | -71.43 | |
| DEMA (21): | 57.05 | |
| Parabolic SAR (0,02-0,02-0,2): | 58.38 | |
| Elder Ray (13): | -0.73 | |
| Super Trend (3,10): | 53.46 | |
| Zig ZAG (10): | 55.64 | |
| VORTEX (21): | 0.8600 | |
| Stochastique (14,3,5): | 39.90 | |
| TEMA (21): | 56.45 | |
| Williams %R (14): | -61.32 | |
| Chande Momentum Oscillator (20): | -2.54 | |
| Repulse (5,40,3): | -0.2100 | |
| ROCnROLL: | 2 | |
| TRIX (15,9): | 0.1300 | |
| Courbe Coppock: | 3.81 |
| MA7: | 56.42 | |
| MA20: | 57.22 | |
| MA50: | 55.31 | |
| MA100: | 55.04 | |
| MAexp7: | 56.37 | |
| MAexp20: | 56.71 | |
| MAexp50: | 56.07 | |
| MAexp100: | 56.87 | |
| Price / MA7: | -1.38% | |
| Price / MA20: | -2.76% | |
| Price / MA50: | +0.60% | |
| Price / MA100: | +1.09% | |
| Price / MAexp7: | -1.30% | |
| Price / MAexp20: | -1.89% | |
| Price / MAexp50: | -0.77% | |
| Price / MAexp100: | -2.16% |
News
Don"t forget to follow the news on INTERDIGITAL INC.. At the time of publication of this analysis, the latest news was as follows:
-
 InterDigital, Inc. - IDCC Stock Chart Technical Analysis for 05-03-2019
-
InterDigital, Inc. - IDCC Stock Chart Technical Analysis for 05-02-2019
-
InterDigital, Inc. - IDCC Stock Chart Technical Analysis for 02-22-18
- InterDigital, Inc. to Host Earnings Call
- InterDigital, Inc. to Host Earnings Call
About author

Online


Add a comment
Comments
0 comments on the analysis INTERDIGITAL INC. - Daily