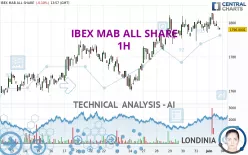
IBEX MAB ALL SHARE - 1H - Technical analysis published on 06/03/2024 (GMT)
- 117
- 0
Click here for a new analysis!
- Timeframe : 1H
- - Analysis generated on
- Status : LEVEL MAINTAINED

Summary of the analysis

Additional analysis
Quotes
The IBEX MAB ALL SHARE price is 1,797.5000 EUR. The price is lower by -0.02% since the last closing and was traded between 1,795.8000 EUR and 1,807.3000 EUR over the period. The price is currently at +0.09% from its lowest and -0.54% from its highest.The Central Gaps scanner detects a bearish opening marking the presence of sellers ahead of buyers at the opening but not sufficiently marked to allow the price to register a quotation gap.
Bearish opening
Type : Bearish
Timeframe : Openning
So that you have an overall view of the price change, here is a table showing the variations over several periods:
Near a new HIGH record (1st january)
Type : Bullish
Timeframe : Weekly
New HIGH record (1 month)
Type : Bullish
Timeframe : Weekly
Technical
Technical analysis of this 1H chart of IBEX MAB ALL SHARE indicates that the overall trend is bullish. 75.00% of the signals given by moving averages are bullish. Caution: the neutral signals currently given by short-term moving averages show us that the global trend is losing momentum. The Central Indicators scanner does not detect any result on moving averages that would impact this trend.
In fact, only 7 technical indicators out of 18 studied are currently bearish. Caution: the Central Indicators scanner currently detects an excess:
Williams %R indicator is oversold : under -80
Type : Neutral
Timeframe : 1 hour
RSI indicator is back under 50
Type : Bearish
Timeframe : 1 hour
The analysis of the price chart with Central Patterns scanners does not return any result.
From the Japanese candlestick perspective, the Central Candlesticks scanner notes the presence of these results that could impact the short-term trend:
Black hanging man / hammer
Type : Neutral
Timeframe : 1 hour
Downside gap
Type : Bearish
Timeframe : 1 hour
| S3 | S2 | S1 | Price | R1 | R2 | R3 | |
|---|---|---|---|---|---|---|---|
| ProTrendLines | 1,771.1000 | 1,782.8600 | 1,789.3000 | 1,797.5000 | 1,798.2000 | 1,829.3000 | 1,847.0000 |
| Change (%) | -1.47% | -0.81% | -0.46% | - | +0.04% | +1.77% | +2.75% |
| Change | -26.4000 | -14.6400 | -8.2000 | - | +0.7000 | +31.8000 | +49.5000 |
| Level | Intermediate | Minor | Intermediate | - | Intermediate | Major | Minor |
To determine price objectives, it is also possible to use the pivot points. Here is the price position in relation to pivot points:
| Pivot points | S3 | S2 | S1 | PP | R1 | R2 | R3 |
|---|---|---|---|---|---|---|---|
| Standard | 1,776.3333 | 1,782.4667 | 1,790.1333 | 1,796.2667 | 1,803.9333 | 1,810.0667 | 1,817.7333 |
| Camarilla | 1,794.0050 | 1,795.2700 | 1,796.5350 | 1,797.8000 | 1,799.0650 | 1,800.3300 | 1,801.5950 |
| Woodie | 1,777.1000 | 1,782.8500 | 1,790.9000 | 1,796.6500 | 1,804.7000 | 1,810.4500 | 1,818.5000 |
| Fibonacci | 1,782.4667 | 1,787.7383 | 1,790.9951 | 1,796.2667 | 1,801.5383 | 1,804.7951 | 1,810.0667 |
| Pivot points | S3 | S2 | S1 | PP | R1 | R2 | R3 |
|---|---|---|---|---|---|---|---|
| Standard | 1,751.1000 | 1,763.4000 | 1,780.6000 | 1,792.9000 | 1,810.1000 | 1,822.4000 | 1,839.6000 |
| Camarilla | 1,789.6875 | 1,792.3917 | 1,795.0958 | 1,797.8000 | 1,800.5042 | 1,803.2083 | 1,805.9125 |
| Woodie | 1,753.5500 | 1,764.6250 | 1,783.0500 | 1,794.1250 | 1,812.5500 | 1,823.6250 | 1,842.0500 |
| Fibonacci | 1,763.4000 | 1,774.6690 | 1,781.6310 | 1,792.9000 | 1,804.1690 | 1,811.1310 | 1,822.4000 |
| Pivot points | S3 | S2 | S1 | PP | R1 | R2 | R3 |
|---|---|---|---|---|---|---|---|
| Standard | 1,660.1000 | 1,690.6000 | 1,744.2000 | 1,774.7000 | 1,828.3000 | 1,858.8000 | 1,912.4000 |
| Camarilla | 1,774.6725 | 1,782.3817 | 1,790.0908 | 1,797.8000 | 1,805.5092 | 1,813.2183 | 1,820.9275 |
| Woodie | 1,671.6500 | 1,696.3750 | 1,755.7500 | 1,780.4750 | 1,839.8500 | 1,864.5750 | 1,923.9500 |
| Fibonacci | 1,690.6000 | 1,722.7262 | 1,742.5738 | 1,774.7000 | 1,806.8262 | 1,826.6738 | 1,858.8000 |
Numerical data
The following are the details of the technical indicators and moving averages that were collected to generate this technical analysis:
| RSI (14): | 49.65 | |
| MACD (12,26,9): | 1.3534 | |
| Directional Movement: | -3.7821 | |
| AROON (14): | 21.4286 | |
| DEMA (21): | 1,800.5164 | |
| Parabolic SAR (0,02-0,02-0,2): | 1,794.7702 | |
| Elder Ray (13): | -2.0828 | |
| Super Trend (3,10): | 1,790.6501 | |
| Zig ZAG (10): | 1,797.5000 | |
| VORTEX (21): | 1.0084 | |
| Stochastique (14,3,5): | 39.90 | |
| TEMA (21): | 1,799.1028 | |
| Williams %R (14): | -75.86 | |
| Chande Momentum Oscillator (20): | -1.5000 | |
| Repulse (5,40,3): | -0.2415 | |
| ROCnROLL: | -1 | |
| TRIX (15,9): | 0.0158 | |
| Courbe Coppock: | 0.05 |
| MA7: | 1,792.6857 | |
| MA20: | 1,776.0050 | |
| MA50: | 1,783.1560 | |
| MA100: | 1,753.2600 | |
| MAexp7: | 1,798.7730 | |
| MAexp20: | 1,798.3156 | |
| MAexp50: | 1,793.5697 | |
| MAexp100: | 1,786.9132 | |
| Price / MA7: | +0.27% | |
| Price / MA20: | +1.21% | |
| Price / MA50: | +0.80% | |
| Price / MA100: | +2.52% | |
| Price / MAexp7: | -0.07% | |
| Price / MAexp20: | -0.05% | |
| Price / MAexp50: | +0.22% | |
| Price / MAexp100: | +0.59% |
About author
Online


Add a comment
Comments
0 comments on the analysis IBEX MAB ALL SHARE - 1H