INTEL CORP. - Daily - Technical analysis published on 02/18/2025 (GMT)
- 92
- 0
- Timeframe : Daily
- - Analysis generated on
- Status : IN PROGRESS...
Summary of the analysis

Additional analysis
Quotes
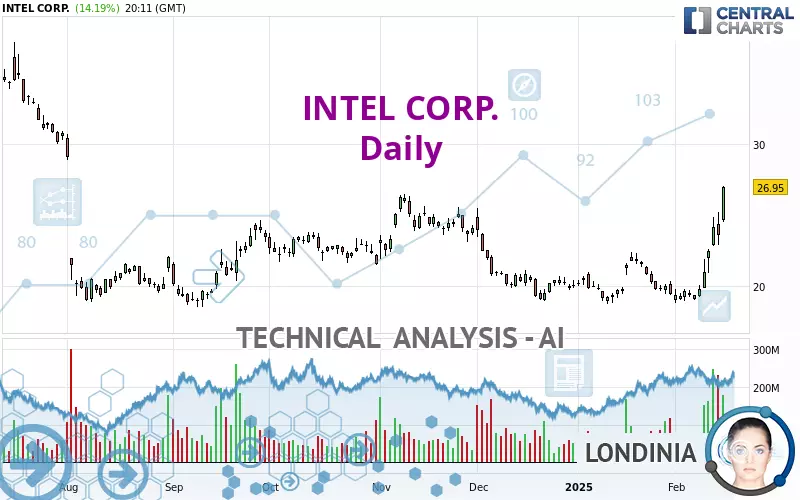
The INTEL CORP. price is 26.93 USD. On the day, this instrument gained +14.11% and was traded between 24.49 USD and 27.03 USD over the period. The price is currently at +9.96% from its lowest and -0.37% from its highest.The Central Gaps scanner detects a bullish opening marking the presence of buyers ahead of sellers at the opening but not sufficiently marked to allow the price to register a quotation gap.
Bullish opening
Type : Bullish
Timeframe : Openning
Here is a more detailed summary of the historical variations registered by INTEL CORP.:
New HIGH record (1st january)
Type : Bullish
Timeframe : Weekly
New HIGH record (1 month)
Type : Bullish
Timeframe : Weekly
The Central Volumes scanner detects abnormal volumes on the asset:
Abnormal volumes
Timeframe : 5 days
Technical
A technical analysis in Daily of this INTEL CORP. chart shows a bullish trend. The signals returned by the moving averages are 78.57% bullish. This bullish trend is reinforced by the strong signals currently being given by short-term moving averages. There is no crossing of moving average by the price or crossing of moving averages between themselves.
The probability of a further increase is high given the direction of the technical indicators.
Caution: the Central Indicators scanner currently detects an excess:
RSI indicator is overbought : over 70
Type : Neutral
Timeframe : Daily
CCI indicator is overbought : over 100
Type : Neutral
Timeframe : Daily
Williams %R indicator is overbought : over -20
Type : Neutral
Timeframe : Daily
Pivot points : price is over resistance 1
Type : Neutral
Timeframe : Weekly
Pivot points : price is over resistance 2
Type : Neutral
Timeframe : Daily
The Central Patterns scanner, which studies chart patterns, resistances and supports, has identified these signals:
Near horizontal resistance
Type : Bearish
Timeframe : Daily
Resistance of channel is broken
Type : Bullish
Timeframe : Daily
The Central Candlesticks scanner which studies Japanese candlesticks did not detect anything.
| S3 | S2 | S1 | Price | R1 | R2 | R3 | |
|---|---|---|---|---|---|---|---|
| ProTrendLines | 21.92 | 23.87 | 26.23 | 26.93 | 29.79 | 32.11 | 34.66 |
| Change (%) | -18.60% | -11.36% | -2.60% | - | +10.62% | +19.24% | +28.70% |
| Change | -5.01 | -3.06 | -0.70 | - | +2.86 | +5.18 | +7.73 |
| Level | Major | Major | Minor | - | Minor | Minor | Major |
Pivot points can also be used to set your price objectives. Here is the price situation in relation to pivot points:
| Pivot points | S3 | S2 | S1 | PP | R1 | R2 | R3 |
|---|---|---|---|---|---|---|---|
| Standard | 20.25 | 21.55 | 22.58 | 23.88 | 24.91 | 26.21 | 27.24 |
| Camarilla | 22.96 | 23.17 | 23.39 | 23.60 | 23.81 | 24.03 | 24.24 |
| Woodie | 20.11 | 21.48 | 22.44 | 23.81 | 24.77 | 26.14 | 27.10 |
| Fibonacci | 21.55 | 22.44 | 22.99 | 23.88 | 24.77 | 25.32 | 26.21 |
| Pivot points | S3 | S2 | S1 | PP | R1 | R2 | R3 |
|---|---|---|---|---|---|---|---|
| Standard | 14.21 | 16.73 | 20.16 | 22.68 | 26.11 | 28.63 | 32.06 |
| Camarilla | 21.96 | 22.51 | 23.06 | 23.60 | 24.15 | 24.69 | 25.24 |
| Woodie | 14.68 | 16.96 | 20.63 | 22.91 | 26.58 | 28.86 | 32.53 |
| Fibonacci | 16.73 | 19.00 | 20.40 | 22.68 | 24.95 | 26.35 | 28.63 |
| Pivot points | S3 | S2 | S1 | PP | R1 | R2 | R3 |
|---|---|---|---|---|---|---|---|
| Standard | 14.29 | 16.51 | 17.97 | 20.19 | 21.65 | 23.87 | 25.33 |
| Camarilla | 18.42 | 18.76 | 19.09 | 19.43 | 19.77 | 20.11 | 20.44 |
| Woodie | 13.91 | 16.32 | 17.59 | 20.00 | 21.27 | 23.68 | 24.95 |
| Fibonacci | 16.51 | 17.92 | 18.78 | 20.19 | 21.60 | 22.46 | 23.87 |
Numerical data
The following is the status of technical indicators and moving averages registered at the time this technical analysis was created:
| RSI (14): | 77.74 | |
| MACD (12,26,9): | 0.9100 | |
| Directional Movement: | 34.27 | |
| AROON (14): | 71.43 | |
| DEMA (21): | 22.34 | |
| Parabolic SAR (0,02-0,02-0,2): | 19.81 | |
| Elder Ray (13): | 3.65 | |
| Super Trend (3,10): | 21.45 | |
| Zig ZAG (10): | 26.90 | |
| VORTEX (21): | 1.0800 | |
| Stochastique (14,3,5): | 87.83 | |
| TEMA (21): | 23.45 | |
| Williams %R (14): | -0.36 | |
| Chande Momentum Oscillator (20): | 6.90 | |
| Repulse (5,40,3): | 13.8000 | |
| ROCnROLL: | 1 | |
| TRIX (15,9): | 0.1200 | |
| Courbe Coppock: | 22.65 |
| MA7: | 22.42 | |
| MA20: | 20.99 | |
| MA50: | 20.50 | |
| MA100: | 21.99 | |
| MAexp7: | 23.22 | |
| MAexp20: | 21.47 | |
| MAexp50: | 21.19 | |
| MAexp100: | 22.24 | |
| Price / MA7: | +20.12% | |
| Price / MA20: | +28.30% | |
| Price / MA50: | +31.37% | |
| Price / MA100: | +22.46% | |
| Price / MAexp7: | +15.98% | |
| Price / MAexp20: | +25.43% | |
| Price / MAexp50: | +27.09% | |
| Price / MAexp100: | +21.09% |
News
The latest news and videos published on INTEL CORP. at the time of the analysis were as follows:
- Intel Corporation to Participate in Upcoming Investor Conferences
- Intel Reports Fourth-Quarter and Full-Year 2024 Financial Results
- Intel Capital to Become Standalone Investment Fund
- Intel to Report Fourth-Quarter and Full-Year 2024 Financial Results
- Lincoln Financial Releases Its Q1 Market Intel Exchange, Highlighting Top Investment Trends on the Minds of Investors
About author

Online


Add a comment
Comments
0 comments on the analysis INTEL CORP. - Daily