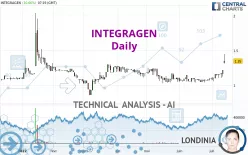
INTEGRAGEN - Daily - Technical analysis published on 07/13/2022 (GMT)
- 346
- 0
Click here for a new analysis!
- Timeframe : Daily
- - Analysis generated on
- Status : INVALID

Summary of the analysis
Additional analysis
Quotes
The INTEGRAGEN rating is 1.350 EUR. On the day, this instrument gained +10.66% and was traded between 1.320 EUR and 1.450 EUR over the period. The price is currently at +2.27% from its lowest and -6.90% from its highest.A bullish gap was detected at the opening by the Central Gaps scanner. There are a lot of buyers and they have the upper hand in the very short term.
Opening Gap UP
Type : Bullish
Timeframe : Openning
A study of price movements over other periods shows the following variations:
New HIGH record (1 month)
Type : Bullish
Timeframe : Weekly
Technical
Technical analysis of this Daily chart of INTEGRAGEN indicates that the overall trend is strongly bullish. 82.14% of the signals given by moving averages are bullish. The overall trend is supported by the strong bullish signals from short-term moving averages. The Central Indicators scanner detects bullish signals on moving averages that could impact this trend:
Bullish trend reversal : Moving Average 50
Type : Bullish
Timeframe : Daily
Bullish trend reversal : Moving Average 100
Type : Bullish
Timeframe : Daily
Moving Average bullish crossovers : MA20 & MA50
Type : Bullish
Timeframe : Daily
Moving Average bullish crossovers : AMA20 & AMA50
Type : Bullish
Timeframe : Daily
In fact, according to the parameters integrated into the Central Analyzer system, 14 technical indicators out of 18 analysed are currently bullish. Caution: the Central Indicators scanner currently detects an excess:
RSI indicator is overbought : over 80
Type : Neutral
Timeframe : Daily
CCI indicator is overbought : over 100
Type : Neutral
Timeframe : Daily
Williams %R indicator is overbought : over -20
Type : Neutral
Timeframe : Daily
Pivot points : price is over resistance 3
Type : Neutral
Timeframe : Daily
Pivot points : price is over resistance 3
Type : Neutral
Timeframe : Weekly
Central Patterns, the market scanner focusing on chart patterns, resistances and supports found this result:
Resistance of channel is broken
Type : Bullish
Timeframe : Daily
The presence of these Japanese chandelier patterns detected by Central Candlesticks that could impact the current short-term trend were also noted:
White gravestone / inverted hammer
Type : Neutral
Timeframe : Daily
White line without lower shadow
Type : Bullish
Timeframe : Daily
Upside gap
Type : Bullish
Timeframe : Daily
Long white line
Type : Bullish
Timeframe : Daily
| S3 | S2 | S1 | Price | R1 | R2 | R3 | |
|---|---|---|---|---|---|---|---|
| ProTrendLines | 1.047 | 1.164 | 1.299 | 1.350 | 1.374 | 1.752 | 2.000 |
| Change (%) | -22.44% | -13.78% | -3.78% | - | +1.78% | +29.78% | +48.15% |
| Change | -0.303 | -0.186 | -0.051 | - | +0.024 | +0.402 | +0.650 |
| Level | Intermediate | Minor | Intermediate | - | Minor | Major | Minor |
Attention could also be paid to pivot points to set price objectives:
| Pivot points | S3 | S2 | S1 | PP | R1 | R2 | R3 |
|---|---|---|---|---|---|---|---|
| Standard | 1.062 | 1.093 | 1.157 | 1.188 | 1.252 | 1.283 | 1.347 |
| Camarilla | 1.194 | 1.203 | 1.211 | 1.220 | 1.229 | 1.237 | 1.246 |
| Woodie | 1.078 | 1.101 | 1.173 | 1.196 | 1.268 | 1.291 | 1.363 |
| Fibonacci | 1.093 | 1.130 | 1.152 | 1.188 | 1.225 | 1.247 | 1.283 |
| Pivot points | S3 | S2 | S1 | PP | R1 | R2 | R3 |
|---|---|---|---|---|---|---|---|
| Standard | 0.993 | 1.027 | 1.093 | 1.127 | 1.193 | 1.227 | 1.293 |
| Camarilla | 1.133 | 1.142 | 1.151 | 1.160 | 1.169 | 1.178 | 1.188 |
| Woodie | 1.010 | 1.035 | 1.110 | 1.135 | 1.210 | 1.235 | 1.310 |
| Fibonacci | 1.027 | 1.065 | 1.089 | 1.127 | 1.165 | 1.189 | 1.227 |
| Pivot points | S3 | S2 | S1 | PP | R1 | R2 | R3 |
|---|---|---|---|---|---|---|---|
| Standard | 0.933 | 0.987 | 1.043 | 1.097 | 1.153 | 1.207 | 1.263 |
| Camarilla | 1.070 | 1.080 | 1.090 | 1.100 | 1.110 | 1.120 | 1.130 |
| Woodie | 0.935 | 0.988 | 1.045 | 1.098 | 1.155 | 1.208 | 1.265 |
| Fibonacci | 0.987 | 1.029 | 1.055 | 1.097 | 1.139 | 1.165 | 1.207 |
Numerical data
The following are the details of the technical indicators and moving averages that were collected to generate this technical analysis:
| RSI (14): | 83.75 | |
| MACD (12,26,9): | 0.0400 | |
| Directional Movement: | 27.041 | |
| AROON (14): | 92.857 | |
| DEMA (21): | 1.194 | |
| Parabolic SAR (0,02-0,02-0,2): | 1.080 | |
| Elder Ray (13): | 0.207 | |
| Super Trend (3,10): | 1.206 | |
| Zig ZAG (10): | 1.390 | |
| VORTEX (21): | 1.1260 | |
| Stochastique (14,3,5): | 92.28 | |
| TEMA (21): | 1.230 | |
| Williams %R (14): | -24.39 | |
| Chande Momentum Oscillator (20): | 0.280 | |
| Repulse (5,40,3): | 7.2390 | |
| ROCnROLL: | 1 | |
| TRIX (15,9): | 0.1710 | |
| Courbe Coppock: | 23.23 |
| MA7: | 1.198 | |
| MA20: | 1.127 | |
| MA50: | 1.118 | |
| MA100: | 1.137 | |
| MAexp7: | 1.212 | |
| MAexp20: | 1.154 | |
| MAexp50: | 1.135 | |
| MAexp100: | 1.151 | |
| Price / MA7: | +12.69% | |
| Price / MA20: | +19.79% | |
| Price / MA50: | +20.75% | |
| Price / MA100: | +18.73% | |
| Price / MAexp7: | +11.39% | |
| Price / MAexp20: | +16.98% | |
| Price / MAexp50: | +18.94% | |
| Price / MAexp100: | +17.29% |
News
Don't forget to follow the news on INTEGRAGEN. At the time of publication of this analysis, the latest news was as follows:
- IntegraGen reports 6.4 M€ in revenues for the first half of 2022 representing 34% growth compared to H1 2021. Cash position of 4.5 M€.
- IntegraGen Reports 2021 Annual Results With a Strong Growth of 20% in Revenue From Current Operations and a Significant Profitability Improvement
- IntegraGen Reports Results for 1st Half of 2021
- IntegraGen Reports Sales of 4.8 M€ for the First Half of 2021, a 2% Increase Versus 2020, and a Cash Position of 4.3 M€
- ONCODNA Provides an Update About the Friendly Takeover Bid on INTEGRAGEN
About author

Online


Add a comment
Comments
0 comments on the analysis INTEGRAGEN - Daily