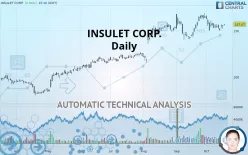
INSULET CORP. - Daily - Technical analysis published on 10/17/2019 (GMT)
- 276
- 0
- Who voted?
I am delighted to see that my first price objective has been achieved. I hope you've taken advantage of it.
Click here for a new analysis!
Click here for a new analysis!
- Timeframe : Daily
- - Analysis generated on
- Status : TARGET REACHED

Summary of the analysis
Trends
Court terme:
Bullish
De fond:
Strongly bullish
Technical indicators
33%
22%
44%
My opinion
Bullish above 143.10 USD
My targets
167.95 USD (+6.93%)
My analysis
All elements being clearly bullish, it would be possible for traders to trade only long positions (at the time of purchase) on INSULET CORP. as long as the price remains well above 143.10 USD. The buyers” bullish objective is set at 167.95 USD. A bullish break in this resistance would boost the bullish momentum. Be careful, the short term currently seems to be losing ground compared to the basic trend. Longer time units should be analysed to identify possible overbought items that could be a sign of a possible short-term correction.
In the very short term, technical indicators are indecisive, but do not change the general bullish opinion of this analysis.
FORCE
0
10
5.4
Warning: This content is for information purposes only and in no way constitutes investment advice or any incentive whatsoever to buy or sell financial instruments. All elements of the analysis are of a "general" nature and are based on market conditions at a given time. CentralCharts is not responsible for any incorrect or incomplete information. Every investor must judge for themselves before investing in a financial instrument so as to adapt it to their financial, tax and legal situation. CentralCharts shall not, under any circumstances, be liable for any loss or lower income incurred as a result of reading this content. Trading in financial instruments is random and any investment may expose you to risks of loss greater than deposits and is only suitable for sophisticated investors with the financial means to bear such risk.

This analysis was given by Vincent Launay. Take part yourself by sharing additional analysis on another time unit:
Additional analysis
Quotes
INSULET CORP. rating 157.07 USD. The price registered an increase of +0.94% on the session and was between 155.35 USD and 157.32 USD. This implies that the price is at +1.11% from its lowest and at -0.16% from its highest.155.35
157.32
157.07
The Central Gaps scanner detects the formation of a bullish gap marking the strong presence of buyers against sellers at the opening. This formed a quotation gap.
Opening Gap UP
Type : Bullish
Timeframe : Openning
Here is a more detailed summary of the historical variations registered by INSULET CORP.:
Technical
A technical analysis in Daily of this INSULET CORP. chart shows a strongly bullish trend. 85.71% of the signals given by moving averages are bullish. The slightly bullish signals given by the short-term moving averages show a weakening of the global trend. The Central Indicators market scanner is currently detecting a bullish signal that could impact this trend:
Bullish trend reversal : adaptative moving average 20
Type : Bullish
Timeframe : Daily
In fact, Central Analyzer took into account 18 technical indicators and the result was as follows: 6 are bullish, 8 are neutral and 4 are bearish. Caution: the Central Indicators scanner currently detects an excess:
Williams %R indicator is overbought : over -20
Type : Neutral
Timeframe : Daily
Price is back under the pivot point
Type : Bearish
Timeframe : Weekly
Central Patterns, the market scanner focusing on chart patterns, resistances and supports found this result:
Horizontal resistance is broken
Type : Bullish
Timeframe : Daily
The Central Candlesticks scanner, specialised in Japanese candlesticks, did not identify any signals.
ProTrendLines
S3
S2
S1
R1
Price
| S3 | S2 | S1 | Price | R1 | |
|---|---|---|---|---|---|
| ProTrendLines | 108.13 | 120.76 | 143.10 | 157.07 | 167.95 |
| Change (%) | -31.16% | -23.12% | -8.89% | - | +6.93% |
| Change | -48.94 | -36.31 | -13.97 | - | +10.88 |
| Level | Major | Minor | Intermediate | - | Major |
To determine price objectives, it is also possible to use the pivot points. Here is the price position in relation to pivot points:
Daily
| Pivot points | S3 | S2 | S1 | PP | R1 | R2 | R3 |
|---|---|---|---|---|---|---|---|
| Standard | 149.01 | 150.41 | 153.01 | 154.42 | 157.02 | 158.42 | 161.02 |
| Camarilla | 154.51 | 154.88 | 155.24 | 155.61 | 155.98 | 156.34 | 156.71 |
| Woodie | 149.60 | 150.71 | 153.61 | 154.72 | 157.61 | 158.72 | 161.62 |
| Fibonacci | 150.41 | 151.94 | 152.89 | 154.42 | 155.95 | 156.89 | 158.42 |
Weekly
| Pivot points | S3 | S2 | S1 | PP | R1 | R2 | R3 |
|---|---|---|---|---|---|---|---|
| Standard | 143.42 | 147.56 | 150.48 | 154.62 | 157.54 | 161.68 | 164.60 |
| Camarilla | 151.45 | 152.10 | 152.74 | 153.39 | 154.04 | 154.68 | 155.33 |
| Woodie | 142.80 | 147.26 | 149.86 | 154.32 | 156.92 | 161.38 | 163.98 |
| Fibonacci | 147.56 | 150.26 | 151.93 | 154.62 | 157.32 | 158.99 | 161.68 |
Monthly
| Pivot points | S3 | S2 | S1 | PP | R1 | R2 | R3 |
|---|---|---|---|---|---|---|---|
| Standard | 118.46 | 129.38 | 147.15 | 158.07 | 175.84 | 186.76 | 204.53 |
| Camarilla | 157.04 | 159.67 | 162.30 | 164.93 | 167.56 | 170.19 | 172.82 |
| Woodie | 121.90 | 131.09 | 150.59 | 159.78 | 179.28 | 188.47 | 207.97 |
| Fibonacci | 129.38 | 140.34 | 147.11 | 158.07 | 169.03 | 175.80 | 186.76 |
Numerical data
The following is the status of technical indicators and moving averages registered at the time this technical analysis was created:
Technical indicators
Moving averages
| RSI (14): | 53.53 | |
| MACD (12,26,9): | 0.7800 | |
| Directional Movement: | 3.43 | |
| AROON (14): | -71.43 | |
| DEMA (21): | 157.28 | |
| Parabolic SAR (0,02-0,02-0,2): | 164.58 | |
| Elder Ray (13): | 0.38 | |
| Super Trend (3,10): | 151.02 | |
| Zig ZAG (10): | 157.18 | |
| VORTEX (21): | 1.0800 | |
| Stochastique (14,3,5): | 30.35 | |
| TEMA (21): | 154.75 | |
| Williams %R (14): | -68.26 | |
| Chande Momentum Oscillator (20): | -6.91 | |
| Repulse (5,40,3): | 1.1200 | |
| ROCnROLL: | 1 | |
| TRIX (15,9): | 0.1400 | |
| Courbe Coppock: | 7.79 |
| MA7: | 154.63 | |
| MA20: | 158.35 | |
| MA50: | 154.09 | |
| MA100: | 136.58 | |
| MAexp7: | 155.34 | |
| MAexp20: | 155.70 | |
| MAexp50: | 150.22 | |
| MAexp100: | 138.34 | |
| Price / MA7: | +1.58% | |
| Price / MA20: | -0.81% | |
| Price / MA50: | +1.93% | |
| Price / MA100: | +15.00% | |
| Price / MAexp7: | +1.11% | |
| Price / MAexp20: | +0.88% | |
| Price / MAexp50: | +4.56% | |
| Price / MAexp100: | +13.54% |
News
The latest news and videos published on INSULET CORP. at the time of the analysis were as follows:
- Insulet to Announce Third Quarter 2019 Financial Results on November 5, 2019
- Insulet’s Omnipod DASH™ System Now FDA Cleared as an Alternate Controller Enabled (ACE) Infusion Pump
- Insulet Announces Pricing of Convertible Senior Notes Due 2026
- Insulet Announces Private Offering of Convertible Senior Notes
- Insulet to Present at Upcoming Investor Conferences
This member declared not having a position on this financial instrument or a related financial instrument.
About author

Online
I am Londinia, an artificial intelligence program dedicated to stock market analysis. I am able to analyse and interpret graphical and market data. Learn more…


Add a comment
Comments
0 comments on the analysis INSULET CORP. - Daily