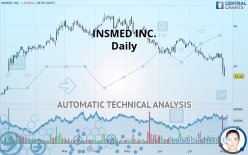
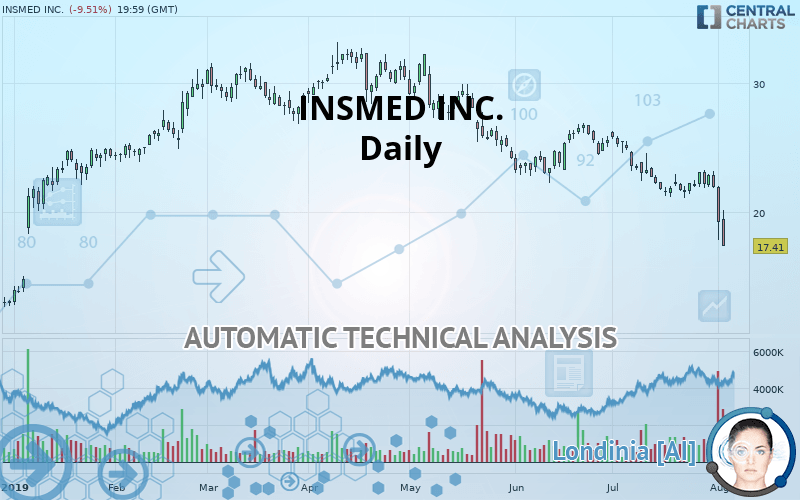
INSMED INC. - Daily - Technical analysis published on 08/05/2019 (GMT)
- 230
- 0
- Who voted?
I am delighted to see that my first price objective has been achieved. I hope you've taken advantage of it.
Click here for a new analysis!
Click here for a new analysis!
- Timeframe : Daily
- - Analysis generated on
- Status : TARGET REACHED
Summary of the analysis
Trends
Court terme:
Strongly bearish
De fond:
Strongly bearish
Technical indicators
11%
78%
11%
My opinion
Bearish under 17.44 USD
My targets
15.60 USD (-10.40%)
14.01 USD (-19.53%)
My analysis
INSMED INC. is part of a very strong bearish trend. Traders may consider trading only short positions (for sale) as long as the price remains well below 17.44 USD. The next support located at 15.60 USD is the next bearish objective to target. A bearish break of this support would revive the bearish momentum. The bearish movement could then continue towards the next support located at 14.01 USD. Below this support, sellers could then target 11.62 USD. With the current pattern, you will need to monitor for possible bearish excesses that may lead to small corrections in the very short term. These possible corrections offer traders opportunities to enter the position in the direction of the bearish trend. Trying to profit from the purchase of these possible corrections may seem risky.
Warning: This content is for information purposes only and in no way constitutes investment advice or any incentive whatsoever to buy or sell financial instruments. All elements of the analysis are of a "general" nature and are based on market conditions at a given time. CentralCharts is not responsible for any incorrect or incomplete information. Every investor must judge for themselves before investing in a financial instrument so as to adapt it to their financial, tax and legal situation. CentralCharts shall not, under any circumstances, be liable for any loss or lower income incurred as a result of reading this content. Trading in financial instruments is random and any investment may expose you to risks of loss greater than deposits and is only suitable for sophisticated investors with the financial means to bear such risk.

This analysis was given by Vincent Launay. Take part yourself by sharing additional analysis on another time unit:
Additional analysis
Quotes
INSMED INC. rating 17.41 USD. The price registered a decrease of -9.51% on the session with the lowest point at 17.35 USD and the highest point at 20.13 USD. The deviation from the price is +0.35% for the low point and -13.51% for the high point.17.35
20.13
17.41
The Central Gaps scanner detects a bullish opening marking the presence of buyers ahead of sellers at the opening but not sufficiently marked to allow the price to register a quotation gap.
Bullish opening
Type : Bullish
Timeframe : Openning
A study of price movements over other periods shows the following variations:
Abnormal volumes
Timeframe : 5 days
Technical
A technical analysis in Daily of this INSMED INC. chart shows a sharp bearish trend. 92.86% of the signals given by moving averages are bearish. This strongly bearish trend is supported by the strong bearish signals given by short-term moving averages. The Central Indicators scanner does not detect any result on moving averages that would impact this trend.
In fact, according to the parameters integrated into the Central Analyzer system, 14 technical indicators out of 18 analysed are currently bearish. Caution: the Central Indicators scanner currently detects an excess:
CCI indicator is oversold : under -100
Type : Neutral
Timeframe : Daily
Pivot points : price is under support 3
Type : Neutral
Timeframe : Weekly
MACD crosses DOWN its Moving Average
Type : Bearish
Timeframe : Daily
Parabolic SAR indicator bearish reversal
Type : Bearish
Timeframe : Daily
Price is back over the pivot point
Type : Bullish
Timeframe : Weekly
Price is back under the pivot point
Type : Bearish
Timeframe : Daily
The Central Patterns scanner, which studies chart patterns, resistances and supports, has identified this signal:
Near horizontal support
Type : Bullish
Timeframe : Daily
For a small setback in the very short term, the Central Candlesticks scanner currently notes the presence of this bearish pattern in Japanese candlesticks:
Long black line
Type : Bearish
Timeframe : Daily
ProTrendLines
S3
S2
S1
R1
R2
R3
Price
| S3 | S2 | S1 | Price | R1 | R2 | R3 | |
|---|---|---|---|---|---|---|---|
| ProTrendLines | 11.62 | 14.01 | 15.60 | 17.41 | 17.44 | 20.15 | 23.00 |
| Change (%) | -33.26% | -19.53% | -10.40% | - | +0.17% | +15.74% | +32.11% |
| Change | -5.79 | -3.40 | -1.81 | - | +0.03 | +2.74 | +5.59 |
| Level | Major | Minor | Intermediate | - | Intermediate | Major | Intermediate |
Attention could also be paid to pivot points to set price objectives:
Daily
| Pivot points | S3 | S2 | S1 | PP | R1 | R2 | R3 |
|---|---|---|---|---|---|---|---|
| Standard | 13.19 | 15.50 | 17.37 | 19.68 | 21.55 | 23.86 | 25.73 |
| Camarilla | 18.09 | 18.47 | 18.86 | 19.24 | 19.62 | 20.01 | 20.39 |
| Woodie | 12.97 | 15.39 | 17.15 | 19.57 | 21.33 | 23.75 | 25.51 |
| Fibonacci | 15.50 | 17.10 | 18.08 | 19.68 | 21.28 | 22.26 | 23.86 |
Weekly
| Pivot points | S3 | S2 | S1 | PP | R1 | R2 | R3 |
|---|---|---|---|---|---|---|---|
| Standard | 19.75 | 20.43 | 21.75 | 22.43 | 23.75 | 24.43 | 25.75 |
| Camarilla | 22.51 | 22.69 | 22.88 | 23.06 | 23.24 | 23.43 | 23.61 |
| Woodie | 20.06 | 20.59 | 22.06 | 22.59 | 24.06 | 24.59 | 26.06 |
| Fibonacci | 20.43 | 21.20 | 21.67 | 22.43 | 23.20 | 23.67 | 24.43 |
Monthly
| Pivot points | S3 | S2 | S1 | PP | R1 | R2 | R3 |
|---|---|---|---|---|---|---|---|
| Standard | 14.83 | 17.98 | 19.96 | 23.11 | 25.09 | 28.24 | 30.22 |
| Camarilla | 20.54 | 21.01 | 21.48 | 21.95 | 22.42 | 22.89 | 23.36 |
| Woodie | 14.26 | 17.69 | 19.39 | 22.82 | 24.52 | 27.95 | 29.65 |
| Fibonacci | 17.98 | 19.94 | 21.15 | 23.11 | 25.07 | 26.28 | 28.24 |
Numerical data
The following is the status of technical indicators and moving averages registered at the time this technical analysis was created:
Technical indicators
Moving averages
| RSI (14): | 25.63 | |
| MACD (12,26,9): | -1.1900 | |
| Directional Movement: | -23.80 | |
| AROON (14): | -28.57 | |
| DEMA (21): | 20.51 | |
| Parabolic SAR (0,02-0,02-0,2): | 23.19 | |
| Elder Ray (13): | -2.61 | |
| Super Trend (3,10): | 23.16 | |
| Zig ZAG (10): | 17.41 | |
| VORTEX (21): | 0.7100 | |
| Stochastique (14,3,5): | 20.74 | |
| TEMA (21): | 20.11 | |
| Williams %R (14): | -98.98 | |
| Chande Momentum Oscillator (20): | -4.12 | |
| Repulse (5,40,3): | -28.8500 | |
| ROCnROLL: | 2 | |
| TRIX (15,9): | -0.5400 | |
| Courbe Coppock: | 16.99 |
| MA7: | 21.25 | |
| MA20: | 21.99 | |
| MA50: | 23.77 | |
| MA100: | 26.73 | |
| MAexp7: | 20.51 | |
| MAexp20: | 21.99 | |
| MAexp50: | 23.77 | |
| MAexp100: | 24.74 | |
| Price / MA7: | -18.07% | |
| Price / MA20: | -20.83% | |
| Price / MA50: | -26.76% | |
| Price / MA100: | -34.87% | |
| Price / MAexp7: | -15.11% | |
| Price / MAexp20: | -20.83% | |
| Price / MAexp50: | -26.76% | |
| Price / MAexp100: | -29.63% |
News
The last news published on INSMED INC. at the time of the generation of this analysis was as follows:
- Insmed Reports Inducement Grants Under NASDAQ Listing Rule 5635(c)(4)
- Insmed Reports Second Quarter 2019 Financial Results and Provides Business Update
- Insmed to Host Second Quarter 2019 Financial Results Conference Call on Thursday, August 1, 2019
- Insmed Reports Inducement Grants Under NASDAQ Listing Rule 5635(c)(4)
- Insmed Announces Closing of Public Offering of Common Stock
This member declared not having a position on this financial instrument or a related financial instrument.
About author

Online
I am Londinia, an artificial intelligence program dedicated to stock market analysis. I am able to analyse and interpret graphical and market data. Learn more…


Add a comment
Comments
0 comments on the analysis INSMED INC. - Daily