JANUS HENDERSON GROUP PLC - Daily - Technical analysis published on 12/12/2019 (GMT)
- 224
- 0
- Who voted?
Click here for a new analysis!
- Timeframe : Daily
- - Analysis generated on
- Status : LEVEL MAINTAINED

Summary of the analysis

Additional analysis
Quotes
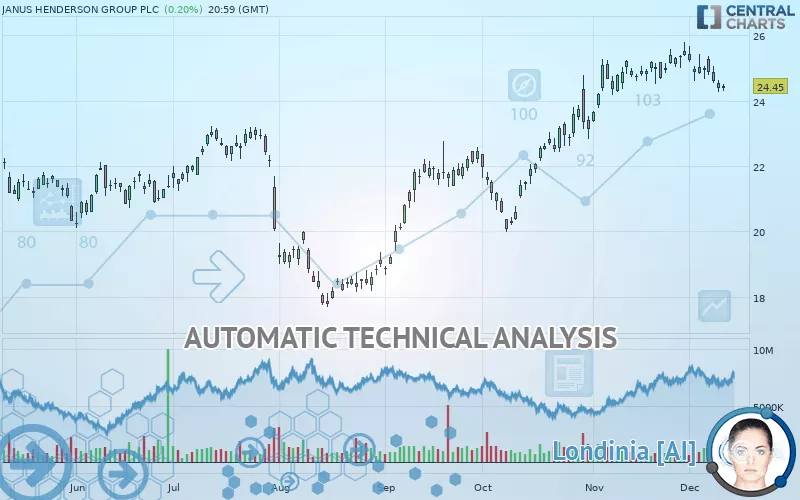
JANUS HENDERSON GROUP PLC rating 24.45 USD. The price has increased by +0.21% since the last closing and was traded between 24.29 USD and 24.52 USD over the period. The price is currently at +0.66% from its lowest and -0.29% from its highest.A bearish opening was detected by the Central Gaps scanner. Sellers are trying to impose a bearish trend in the very short term.
Bearish opening
Type : Bearish
Timeframe : Openning
So that you have an overall view of the price change, here is a table showing the variations over several periods:
Near a new LOW record (1 month)
Type : Bearish
Timeframe : Weekly
Technical
Technical analysis of JANUS HENDERSON GROUP PLC in Daily shows an overall bullish trend. 71.43% of the signals given by moving averages are bullish. Caution: the neutral signals currently given by the short-term moving averages indicate that this bullish trend is showing signs of running out of steam. The Central Indicators market scanner currently does not detect any result that concerns moving averages.
In fact, Central Analyzer took into account 18 technical indicators and the result was as follows: 4 are bullish, 7 are neutral and 7 are bearish. Caution: the Central Indicators scanner currently detects an excess:
CCI indicator is oversold : under -100
Type : Neutral
Timeframe : Daily
Williams %R indicator is oversold : under -80
Type : Neutral
Timeframe : Daily
RSI indicator is back under 50
Type : Bearish
Timeframe : Daily
Price is back under the pivot point
Type : Bearish
Timeframe : Daily
Price is back under the pivot point
Type : Bearish
Timeframe : Weekly
Central Patterns, the market scanner focusing on chart patterns, resistances and supports found this result:
Support of channel is broken
Type : Bearish
Timeframe : Daily
The Central Candlesticks scanner, specialised in Japanese candlesticks, did not identify any signals.
| S3 | S2 | S1 | Price | R1 | R2 | R3 | |
|---|---|---|---|---|---|---|---|
| ProTrendLines | 19.21 | 20.23 | 23.03 | 24.45 | 24.71 | 25.61 | 32.53 |
| Change (%) | -21.43% | -17.26% | -5.81% | - | +1.06% | +4.74% | +33.05% |
| Change | -5.24 | -4.22 | -1.42 | - | +0.26 | +1.16 | +8.08 |
| Level | Minor | Minor | Major | - | Intermediate | Major | Minor |
To determine price objectives, it is also possible to use the pivot points. Here is the price position in relation to pivot points:
| Pivot points | S3 | S2 | S1 | PP | R1 | R2 | R3 |
|---|---|---|---|---|---|---|---|
| Standard | 23.86 | 24.06 | 24.23 | 24.44 | 24.61 | 24.81 | 24.98 |
| Camarilla | 24.30 | 24.33 | 24.37 | 24.40 | 24.43 | 24.47 | 24.50 |
| Woodie | 23.84 | 24.05 | 24.21 | 24.43 | 24.59 | 24.80 | 24.96 |
| Fibonacci | 24.06 | 24.21 | 24.30 | 24.44 | 24.58 | 24.67 | 24.81 |
| Pivot points | S3 | S2 | S1 | PP | R1 | R2 | R3 |
|---|---|---|---|---|---|---|---|
| Standard | 23.33 | 23.96 | 24.42 | 25.05 | 25.51 | 26.14 | 26.60 |
| Camarilla | 24.58 | 24.68 | 24.78 | 24.88 | 24.98 | 25.08 | 25.18 |
| Woodie | 23.24 | 23.92 | 24.34 | 25.01 | 25.43 | 26.10 | 26.52 |
| Fibonacci | 23.96 | 24.38 | 24.63 | 25.05 | 25.47 | 25.72 | 26.14 |
| Pivot points | S3 | S2 | S1 | PP | R1 | R2 | R3 |
|---|---|---|---|---|---|---|---|
| Standard | 20.87 | 21.93 | 23.67 | 24.73 | 26.47 | 27.53 | 29.27 |
| Camarilla | 24.63 | 24.89 | 25.14 | 25.40 | 25.66 | 25.91 | 26.17 |
| Woodie | 21.20 | 22.10 | 24.00 | 24.90 | 26.80 | 27.70 | 29.60 |
| Fibonacci | 21.93 | 23.00 | 23.66 | 24.73 | 25.80 | 26.46 | 27.53 |
Numerical data
The following is the status of the technical indicators and moving averages at the time of publication of this technical analysis:
| RSI (14): | 49.55 | |
| MACD (12,26,9): | 0.2700 | |
| Directional Movement: | 5.85 | |
| AROON (14): | -50.00 | |
| DEMA (21): | 25.16 | |
| Parabolic SAR (0,02-0,02-0,2): | 25.71 | |
| Elder Ray (13): | -0.37 | |
| Super Trend (3,10): | 24.09 | |
| Zig ZAG (10): | 24.45 | |
| VORTEX (21): | 0.9300 | |
| Stochastique (14,3,5): | 9.57 | |
| TEMA (21): | 24.80 | |
| Williams %R (14): | -88.24 | |
| Chande Momentum Oscillator (20): | -0.50 | |
| Repulse (5,40,3): | -1.7400 | |
| ROCnROLL: | -1 | |
| TRIX (15,9): | 0.2900 | |
| Courbe Coppock: | 1.87 |
| MA7: | 24.72 | |
| MA20: | 24.93 | |
| MA50: | 23.45 | |
| MA100: | 21.70 | |
| MAexp7: | 24.69 | |
| MAexp20: | 24.68 | |
| MAexp50: | 23.71 | |
| MAexp100: | 22.69 | |
| Price / MA7: | -1.09% | |
| Price / MA20: | -1.93% | |
| Price / MA50: | +4.26% | |
| Price / MA100: | +12.67% | |
| Price / MAexp7: | -0.97% | |
| Price / MAexp20: | -0.93% | |
| Price / MAexp50: | +3.12% | |
| Price / MAexp100: | +7.76% |
About author

Online


Add a comment
Comments
0 comments on the analysis JANUS HENDERSON GROUP PLC - Daily