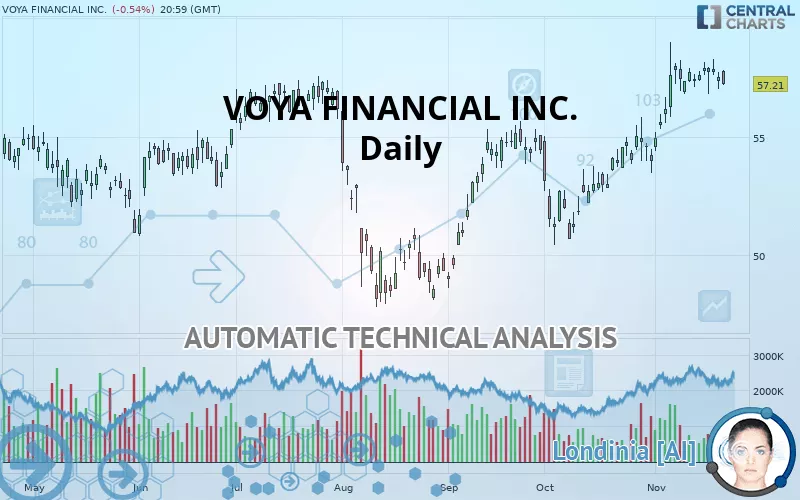
VOYA FINANCIAL INC. - Daily - Technical analysis published on 11/22/2019 (GMT)
- 324
- 0
- Who voted?
Click here for a new analysis!
- Timeframe : Daily
- - Analysis generated on
- Status : TARGET REACHED

Summary of the analysis

Additional analysis
Quotes
The VOYA FINANCIAL INC. rating is 57.21 USD. On the day, this instrument lost -0.54% with the lowest point at 57.17 USD and the highest point at 57.82 USD. The deviation from the price is +0.07% for the low point and -1.05% for the high point.The Central Gaps scanner detects the formation of a bullish gap marking the strong presence of buyers against sellers at the opening. This formed a quotation gap.
Opening Gap UP
Type : Bullish
Timeframe : Openning
Here is a more detailed summary of the historical variations registered by VOYA FINANCIAL INC.:
Near a new HIGH record (5 years)
Type : Bullish
Timeframe : Weekly
Near a new HIGH record (1 year)
Type : Bullish
Timeframe : Weekly
Near a new HIGH record (1st january)
Type : Bullish
Timeframe : Weekly
Near a new HIGH record (1 month)
Type : Bullish
Timeframe : Weekly
Technical
Technical analysis of this Daily chart of VOYA FINANCIAL INC. indicates that the overall trend is strongly bullish. 92.86% of the signals given by moving averages are bullish. This strongly bullish trend is supported by the strong bullish signals given by short-term moving averages. There is no crossing of moving average by the price or crossing of moving averages between themselves.
In fact, 10 technical indicators on 18 studied are currently positioned bullish. Other results related to technical indicators were also found by the Central Indicators scanner:
Price is back over the pivot point
Type : Bullish
Timeframe : Daily
Price is back over the pivot point
Type : Bullish
Timeframe : Weekly
The Central Patterns scanner, which studies chart patterns, resistances and supports, has identified this signal:
Horizontal support is broken
Type : Bearish
Timeframe : Daily
No result was found by the Central Candlesticks scanner on Japanese candlesticks.
| S3 | S2 | S1 | Price | R1 | |
|---|---|---|---|---|---|
| ProTrendLines | 48.12 | 50.92 | 55.19 | 57.21 | 57.32 |
| Change (%) | -15.89% | -10.99% | -3.53% | - | +0.19% |
| Change | -9.09 | -6.29 | -2.02 | - | +0.11 |
| Level | Major | Minor | Major | - | Intermediate |
To determine price objectives, it is also possible to use the pivot points. Here is the price position in relation to pivot points:
| Pivot points | S3 | S2 | S1 | PP | R1 | R2 | R3 |
|---|---|---|---|---|---|---|---|
| Standard | 56.42 | 56.72 | 57.12 | 57.42 | 57.82 | 58.12 | 58.52 |
| Camarilla | 57.33 | 57.39 | 57.46 | 57.52 | 57.58 | 57.65 | 57.71 |
| Woodie | 56.47 | 56.75 | 57.17 | 57.45 | 57.87 | 58.15 | 58.57 |
| Fibonacci | 56.72 | 56.99 | 57.15 | 57.42 | 57.69 | 57.85 | 58.12 |
| Pivot points | S3 | S2 | S1 | PP | R1 | R2 | R3 |
|---|---|---|---|---|---|---|---|
| Standard | 55.75 | 56.29 | 57.10 | 57.64 | 58.45 | 58.99 | 59.80 |
| Camarilla | 57.55 | 57.67 | 57.80 | 57.92 | 58.04 | 58.17 | 58.29 |
| Woodie | 55.90 | 56.36 | 57.25 | 57.71 | 58.60 | 59.06 | 59.95 |
| Fibonacci | 56.29 | 56.80 | 57.12 | 57.64 | 58.15 | 58.47 | 58.99 |
| Pivot points | S3 | S2 | S1 | PP | R1 | R2 | R3 |
|---|---|---|---|---|---|---|---|
| Standard | 45.56 | 47.98 | 50.97 | 53.40 | 56.39 | 58.81 | 61.80 |
| Camarilla | 52.47 | 52.97 | 53.46 | 53.96 | 54.46 | 54.95 | 55.45 |
| Woodie | 45.84 | 48.12 | 51.25 | 53.54 | 56.67 | 58.95 | 62.08 |
| Fibonacci | 47.98 | 50.05 | 51.33 | 53.40 | 55.46 | 56.74 | 58.81 |
Numerical data
The following are the details of the technical indicators and moving averages that were collected to generate this technical analysis:
| RSI (14): | 60.84 | |
| MACD (12,26,9): | 1.0300 | |
| Directional Movement: | 12.77 | |
| AROON (14): | 21.43 | |
| DEMA (21): | 57.94 | |
| Parabolic SAR (0,02-0,02-0,2): | 56.27 | |
| Elder Ray (13): | 0.40 | |
| Super Trend (3,10): | 55.06 | |
| Zig ZAG (10): | 57.21 | |
| VORTEX (21): | 1.0800 | |
| Stochastique (14,3,5): | 65.55 | |
| TEMA (21): | 58.25 | |
| Williams %R (14): | -48.77 | |
| Chande Momentum Oscillator (20): | 1.05 | |
| Repulse (5,40,3): | -0.7900 | |
| ROCnROLL: | 1 | |
| TRIX (15,9): | 0.2900 | |
| Courbe Coppock: | 9.31 |
| MA7: | 57.60 | |
| MA20: | 56.51 | |
| MA50: | 54.70 | |
| MA100: | 53.77 | |
| MAexp7: | 57.46 | |
| MAexp20: | 56.57 | |
| MAexp50: | 55.04 | |
| MAexp100: | 53.95 | |
| Price / MA7: | -0.68% | |
| Price / MA20: | +1.24% | |
| Price / MA50: | +4.59% | |
| Price / MA100: | +6.40% | |
| Price / MAexp7: | -0.44% | |
| Price / MAexp20: | +1.13% | |
| Price / MAexp50: | +3.94% | |
| Price / MAexp100: | +6.04% |
News
The latest news and videos published on VOYA FINANCIAL INC. at the time of the analysis were as follows:
- Voya Selected as New Service Provider for New Mexico PERA SmartSave Deferred Compensation Plan
- Voya Global Advantage and Premium Opportunity Fund & Voya Infrastructure, Industrials and Materials Fund Announce Payment of Quarterly Distribution
- Voya Equity Closed End Funds Declare Distributions
- Voya Honors San Antonio Teacher with Second-Place Unsung Heroes Program Award
- Voya Financial Schedules Announcement of Third-Quarter 2019 Results
About author

Online


Add a comment
Comments
0 comments on the analysis VOYA FINANCIAL INC. - Daily