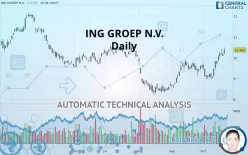
ING GROEP N.V. - Daily - Technical analysis published on 10/21/2019 (GMT)
- 414
- 0
- Who voted?
Click here for a new analysis!
- Timeframe : Daily
- - Analysis generated on
- Status : TARGET REACHED

Summary of the analysis

Additional analysis
Quotes
The ING GROEP N.V. rating is 10.362 EUR. The price has increased by +1.97% since the last closing and was traded between 10.174 EUR and 10.486 EUR over the period. The price is currently at +1.85% from its lowest and -1.18% from its highest.The Central Gaps scanner detects a bullish opening marking the presence of buyers ahead of sellers at the opening but not sufficiently marked to allow the price to register a quotation gap.
Bullish opening
Type : Bullish
Timeframe : Openning
So that you have an overall view of the price change, here is a table showing the variations over several periods:
Technical
Technical analysis of this Daily chart of ING GROEP N.V. indicates that the overall trend is strongly bullish. 85.71% of the signals given by moving averages are bullish. The overall trend is supported by the strong bullish signals from short-term moving averages. There is no crossing of moving average by the price or crossing of moving averages between themselves.
Technical indicators are strongly bullish, suggesting that the price increase should continue.
Caution: the Central Indicators scanner currently detects an excess:
CCI indicator is overbought : over 100
Type : Neutral
Timeframe : Daily
Williams %R indicator is overbought : over -20
Type : Neutral
Timeframe : Daily
Pivot points : price is over resistance 2
Type : Neutral
Timeframe : Daily
Price is back over the pivot point
Type : Bullish
Timeframe : Weekly
An analysis of the price chart with the Central Patterns scanner (detector of chart patterns and resistances and supports) shows a result that can have an impact on the price change:
Near resistance of channel
Type : Bearish
Timeframe : Daily
The Central Candlesticks scanner, specialised in Japanese candlesticks, did not identify any signals.
| S3 | S2 | S1 | Price | R1 | R2 | R3 | |
|---|---|---|---|---|---|---|---|
| ProTrendLines | 8.549 | 9.302 | 9.833 | 10.362 | 10.480 | 11.071 | 11.672 |
| Change (%) | -17.50% | -10.23% | -5.11% | - | +1.14% | +6.84% | +12.64% |
| Change | -1.813 | -1.060 | -0.529 | - | +0.118 | +0.709 | +1.310 |
| Level | Intermediate | Major | Intermediate | - | Major | Minor | Minor |
Attention could also be paid to pivot points to set price objectives:
| Pivot points | S3 | S2 | S1 | PP | R1 | R2 | R3 |
|---|---|---|---|---|---|---|---|
| Standard | 9.898 | 9.982 | 10.072 | 10.156 | 10.246 | 10.330 | 10.420 |
| Camarilla | 10.114 | 10.130 | 10.146 | 10.162 | 10.178 | 10.194 | 10.210 |
| Woodie | 9.901 | 9.984 | 10.075 | 10.158 | 10.249 | 10.332 | 10.423 |
| Fibonacci | 9.982 | 10.049 | 10.090 | 10.156 | 10.223 | 10.264 | 10.330 |
| Pivot points | S3 | S2 | S1 | PP | R1 | R2 | R3 |
|---|---|---|---|---|---|---|---|
| Standard | 9.000 | 9.331 | 9.747 | 10.078 | 10.494 | 10.825 | 11.241 |
| Camarilla | 9.957 | 10.025 | 10.094 | 10.162 | 10.231 | 10.299 | 10.367 |
| Woodie | 9.042 | 9.352 | 9.789 | 10.099 | 10.536 | 10.846 | 11.283 |
| Fibonacci | 9.331 | 9.617 | 9.793 | 10.078 | 10.364 | 10.540 | 10.825 |
| Pivot points | S3 | S2 | S1 | PP | R1 | R2 | R3 |
|---|---|---|---|---|---|---|---|
| Standard | 7.480 | 8.014 | 8.809 | 9.343 | 10.138 | 10.672 | 11.467 |
| Camarilla | 9.239 | 9.360 | 9.482 | 9.604 | 9.726 | 9.848 | 9.970 |
| Woodie | 7.611 | 8.079 | 8.940 | 9.408 | 10.269 | 10.737 | 11.598 |
| Fibonacci | 8.014 | 8.522 | 8.835 | 9.343 | 9.851 | 10.164 | 10.672 |
Numerical data
The following is the status of technical indicators and moving averages registered at the time this technical analysis was created:
| RSI (14): | 71.24 | |
| MACD (12,26,9): | 0.2480 | |
| Directional Movement: | 26.224 | |
| AROON (14): | 64.286 | |
| DEMA (21): | 9.991 | |
| Parabolic SAR (0,02-0,02-0,2): | 9.408 | |
| Elder Ray (13): | 0.485 | |
| Super Trend (3,10): | 9.544 | |
| Zig ZAG (10): | 10.362 | |
| VORTEX (21): | 1.1070 | |
| Stochastique (14,3,5): | 85.63 | |
| TEMA (21): | 10.159 | |
| Williams %R (14): | -8.12 | |
| Chande Momentum Oscillator (20): | 1.286 | |
| Repulse (5,40,3): | 3.0320 | |
| ROCnROLL: | 1 | |
| TRIX (15,9): | 0.2330 | |
| Courbe Coppock: | 13.44 |
| MA7: | 10.085 | |
| MA20: | 9.582 | |
| MA50: | 9.207 | |
| MA100: | 9.462 | |
| MAexp7: | 10.050 | |
| MAexp20: | 9.705 | |
| MAexp50: | 9.484 | |
| MAexp100: | 9.522 | |
| Price / MA7: | +2.75% | |
| Price / MA20: | +8.14% | |
| Price / MA50: | +12.54% | |
| Price / MA100: | +9.51% | |
| Price / MAexp7: | +3.10% | |
| Price / MAexp20: | +6.77% | |
| Price / MAexp50: | +9.26% | |
| Price / MAexp100: | +8.82% |
News
The last news published on ING GROEP N.V. at the time of the generation of this analysis was as follows:
- ING publishes first Terra progress report
- ING posts 2Q2019 net result of €1,438 million
- Roland Boekhout will leave ING to join Commerzbank
- ING posts 1Q19 net result of €1,119 million
- ING to redeem US$ 1,045 million Perpetual Hybrid Capital Securities
About author

Online


Add a comment
Comments
0 comments on the analysis ING GROEP N.V. - Daily