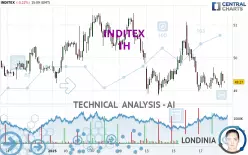
INDITEX - 1H - Technical analysis published on 01/20/2025 (GMT)
- 131
- 0
Click here for a new analysis!
- Timeframe : 1H
- - Analysis generated on
- Status : TARGET REACHED

Summary of the analysis

Additional analysis
Quotes
The INDITEX price is 49.27 EUR. The price is lower by -0.22% since the last closing and was traded between 49.10 EUR and 49.71 EUR over the period. The price is currently at +0.35% from its lowest and -0.89% from its highest.The Central Gaps scanner detects a bullish opening marking the presence of buyers ahead of sellers at the opening but not sufficiently marked to allow the price to register a quotation gap.
Bullish opening
Type : Bullish
Timeframe : Openning
A study of price movements over other periods shows the following variations:
Near a new HIGH record (1st january)
Type : Bullish
Timeframe : Weekly
Near a new HIGH record (1 month)
Type : Bullish
Timeframe : Weekly
Technical
Technical analysis of this 1H chart of INDITEX indicates that the overall trend is strongly bearish. 85.71% of the signals given by moving averages are bearish. This strongly bearish trend is supported by the strong bearish signals given by short-term moving averages. The Central Indicators market scanner is currently detecting a bullish signal that could impact this trend:
Bullish trend reversal : Moving Average 50
Type : Bullish
Timeframe : 1 hour
In fact, of the 18 technical indicators analysed by Central Analyzer, 6 are bullish, 10 are neutral and 2 are bearish. Central Indicators, the scanner specialised in technical indicators, has identified these signals:
RSI indicator is back under 50
Type : Bearish
Timeframe : 1 hour
Williams %R indicator is back under -50
Type : Bearish
Timeframe : 1 hour
Central Patterns, the market scanner focusing on chart patterns, resistances and supports found this result:
Near resistance of channel
Type : Bearish
Timeframe : 1 hour
The Central Candlesticks scanner currently notes the presence of this pattern in Japanese candlesticks that could mark the end of the short-term trend currently underway:
Doji
Type : Neutral
Timeframe : 1 hour
| S3 | S2 | S1 | Price | R1 | R2 | R3 | |
|---|---|---|---|---|---|---|---|
| ProTrendLines | 47.15 | 48.93 | 49.23 | 49.27 | 49.62 | 49.91 | 50.28 |
| Change (%) | -4.30% | -0.69% | -0.08% | - | +0.71% | +1.30% | +2.05% |
| Change | -2.12 | -0.34 | -0.04 | - | +0.35 | +0.64 | +1.01 |
| Level | Intermediate | Minor | Intermediate | - | Minor | Minor | Intermediate |
Pivot points can also be used to set your price objectives. Here is the price situation in relation to pivot points:
| Pivot points | S3 | S2 | S1 | PP | R1 | R2 | R3 |
|---|---|---|---|---|---|---|---|
| Standard | 48.59 | 48.82 | 49.10 | 49.33 | 49.61 | 49.84 | 50.12 |
| Camarilla | 49.24 | 49.29 | 49.33 | 49.38 | 49.43 | 49.47 | 49.52 |
| Woodie | 48.62 | 48.83 | 49.13 | 49.34 | 49.64 | 49.85 | 50.15 |
| Fibonacci | 48.82 | 49.02 | 49.14 | 49.33 | 49.53 | 49.65 | 49.84 |
| Pivot points | S3 | S2 | S1 | PP | R1 | R2 | R3 |
|---|---|---|---|---|---|---|---|
| Standard | 46.22 | 47.54 | 48.46 | 49.78 | 50.70 | 52.02 | 52.94 |
| Camarilla | 48.76 | 48.97 | 49.18 | 49.38 | 49.59 | 49.79 | 50.00 |
| Woodie | 46.02 | 47.44 | 48.26 | 49.68 | 50.50 | 51.92 | 52.74 |
| Fibonacci | 47.54 | 48.40 | 48.92 | 49.78 | 50.64 | 51.16 | 52.02 |
| Pivot points | S3 | S2 | S1 | PP | R1 | R2 | R3 |
|---|---|---|---|---|---|---|---|
| Standard | 39.52 | 44.23 | 46.93 | 51.64 | 54.34 | 59.05 | 61.75 |
| Camarilla | 47.60 | 48.28 | 48.96 | 49.64 | 50.32 | 51.00 | 51.68 |
| Woodie | 38.53 | 43.73 | 45.94 | 51.14 | 53.35 | 58.55 | 60.76 |
| Fibonacci | 44.23 | 47.06 | 48.81 | 51.64 | 54.47 | 56.22 | 59.05 |
Numerical data
The following are the details of the technical indicators and moving averages that were collected to generate this technical analysis:
| RSI (14): | 46.35 | |
| MACD (12,26,9): | -0.1000 | |
| Directional Movement: | 10.38 | |
| AROON (14): | 28.57 | |
| DEMA (21): | 49.25 | |
| Parabolic SAR (0,02-0,02-0,2): | 49.05 | |
| Elder Ray (13): | 0.06 | |
| Super Trend (3,10): | 49.85 | |
| Zig ZAG (10): | 49.29 | |
| VORTEX (21): | 0.8600 | |
| Stochastique (14,3,5): | 47.98 | |
| TEMA (21): | 49.23 | |
| Williams %R (14): | -69.70 | |
| Chande Momentum Oscillator (20): | 0.08 | |
| Repulse (5,40,3): | -0.0500 | |
| ROCnROLL: | 2 | |
| TRIX (15,9): | -0.0400 | |
| Courbe Coppock: | 0.15 |
| MA7: | 49.48 | |
| MA20: | 49.89 | |
| MA50: | 51.27 | |
| MA100: | 51.44 | |
| MAexp7: | 49.30 | |
| MAexp20: | 49.40 | |
| MAexp50: | 49.61 | |
| MAexp100: | 49.88 | |
| Price / MA7: | -0.42% | |
| Price / MA20: | -1.24% | |
| Price / MA50: | -3.90% | |
| Price / MA100: | -4.22% | |
| Price / MAexp7: | -0.06% | |
| Price / MAexp20: | -0.26% | |
| Price / MAexp50: | -0.69% | |
| Price / MAexp100: | -1.22% |
News
Don't forget to follow the news on INDITEX. At the time of publication of this analysis, the latest news was as follows:
- Apranga Group extends successful collaboration with Inditex
- Apranga Group extends successful collaboration with Inditex
-
 UK GDP latest, Poland's Duda visits Washington, Inditex results
-
Key Brexit votes, energy leaders' shale focus, Inditex reports
-
Brexit deal vote, ECB meeting, Inditex results
About author
Online


Add a comment
Comments
0 comments on the analysis INDITEX - 1H