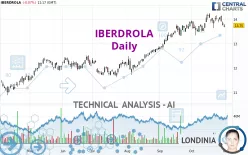
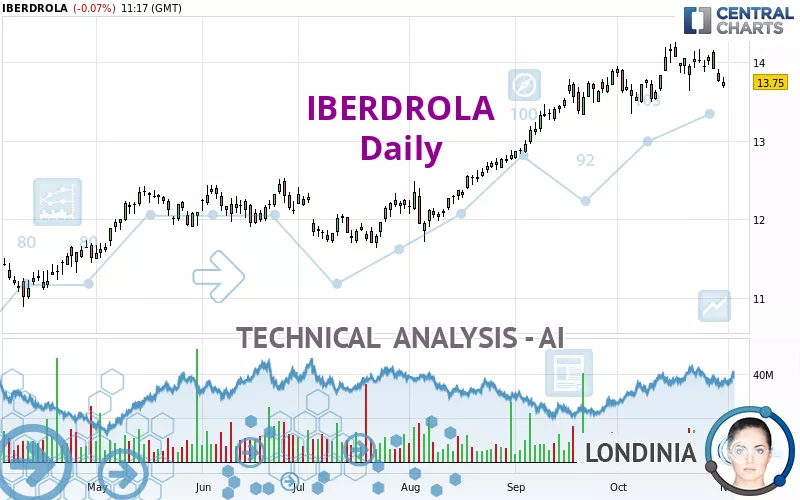
IBERDROLA - Daily - Technical analysis published on 10/31/2024 (GMT)
- 116
- 0
Click here for a new analysis!
- Timeframe : Daily
- - Analysis generated on
- Status : INVALID
Summary of the analysis

Additional analysis
Quotes
The IBERDROLA rating is 13.750 EUR. The price registered a decrease of -0.07% on the session and was traded between 13.675 EUR and 13.820 EUR over the period. The price is currently at +0.55% from its lowest and -0.51% from its highest.A bearish gap was detected at the opening by the Central Gaps scanner. There are a lot of sellers and they have the upper hand in the very short term.
Opening Gap DOWN
Type : Bearish
Timeframe : Openning
A study of price movements over other periods shows the following variations:
Near a new HIGH record (5 years)
Type : Bullish
Timeframe : Weekly
Near a new HIGH record (1 year)
Type : Bullish
Timeframe : Weekly
Near a new HIGH record (1st january)
Type : Bullish
Timeframe : Weekly
Near a new HIGH record (1 month)
Type : Bullish
Timeframe : Weekly
Technical
Technical analysis of this Daily chart of IBERDROLA indicates that the overall trend is bullish. 75.00% of the signals given by moving averages are bullish. Caution: the neutral signals currently given by short-term moving averages show us that the global trend is losing momentum. The Central Indicators market scanner is currently detecting a bearish signal that could impact this trend:
Bearish trend reversal : adaptative moving average 20
Type : Bearish
Timeframe : Daily
The probability of a further decline is moderate given the direction of the technical indicators.
Caution: the Central Indicators scanner currently detects an excess:
Williams %R indicator is oversold : under -80
Type : Neutral
Timeframe : Daily
Price is back under the pivot point
Type : Bearish
Timeframe : Weekly
No signals are given by Central Patterns, a market scanner specialised in chart patterns, resistances and supports.
No result was found by the Central Candlesticks scanner on Japanese candlesticks.
| S3 | S2 | S1 | Price | R1 | |
|---|---|---|---|---|---|
| ProTrendLines | 11.493 | 12.020 | 13.505 | 13.750 | 14.175 |
| Change (%) | -16.41% | -12.58% | -1.78% | - | +3.09% |
| Change | -2.257 | -1.730 | -0.245 | - | +0.425 |
| Level | Minor | Intermediate | Major | - | Major |
Attention could also be paid to pivot points to set price objectives:
| Pivot points | S3 | S2 | S1 | PP | R1 | R2 | R3 |
|---|---|---|---|---|---|---|---|
| Standard | 13.552 | 13.653 | 13.707 | 13.808 | 13.862 | 13.963 | 14.017 |
| Camarilla | 13.717 | 13.732 | 13.746 | 13.760 | 13.774 | 13.788 | 13.803 |
| Woodie | 13.528 | 13.641 | 13.683 | 13.796 | 13.838 | 13.951 | 13.993 |
| Fibonacci | 13.653 | 13.713 | 13.749 | 13.808 | 13.868 | 13.904 | 13.963 |
| Pivot points | S3 | S2 | S1 | PP | R1 | R2 | R3 |
|---|---|---|---|---|---|---|---|
| Standard | 13.132 | 13.383 | 13.667 | 13.918 | 14.202 | 14.453 | 14.737 |
| Camarilla | 13.803 | 13.852 | 13.901 | 13.950 | 13.999 | 14.048 | 14.097 |
| Woodie | 13.148 | 13.391 | 13.683 | 13.926 | 14.218 | 14.461 | 14.753 |
| Fibonacci | 13.383 | 13.588 | 13.714 | 13.918 | 14.123 | 14.249 | 14.453 |
| Pivot points | S3 | S2 | S1 | PP | R1 | R2 | R3 |
|---|---|---|---|---|---|---|---|
| Standard | 11.983 | 12.377 | 13.133 | 13.527 | 14.283 | 14.677 | 15.433 |
| Camarilla | 13.574 | 13.679 | 13.785 | 13.890 | 13.995 | 14.101 | 14.206 |
| Woodie | 12.165 | 12.468 | 13.315 | 13.618 | 14.465 | 14.768 | 15.615 |
| Fibonacci | 12.377 | 12.816 | 13.087 | 13.527 | 13.966 | 14.237 | 14.677 |
Numerical data
The following is the status of the technical indicators and moving averages at the time of publication of this technical analysis:
| RSI (14): | 49.59 | |
| MACD (12,26,9): | 0.1040 | |
| Directional Movement: | -1.346 | |
| AROON (14): | 28.571 | |
| DEMA (21): | 14.017 | |
| Parabolic SAR (0,02-0,02-0,2): | 14.250 | |
| Elder Ray (13): | -0.143 | |
| Super Trend (3,10): | 13.502 | |
| Zig ZAG (10): | 13.765 | |
| VORTEX (21): | 0.9770 | |
| Stochastique (14,3,5): | 36.25 | |
| TEMA (21): | 13.924 | |
| Williams %R (14): | -78.40 | |
| Chande Momentum Oscillator (20): | -0.295 | |
| Repulse (5,40,3): | -1.0070 | |
| ROCnROLL: | -1 | |
| TRIX (15,9): | 0.1610 | |
| Courbe Coppock: | 2.55 |
| MA7: | 13.934 | |
| MA20: | 13.863 | |
| MA50: | 13.534 | |
| MA100: | 12.772 | |
| MAexp7: | 13.886 | |
| MAexp20: | 13.847 | |
| MAexp50: | 13.495 | |
| MAexp100: | 12.955 | |
| Price / MA7: | -1.32% | |
| Price / MA20: | -0.82% | |
| Price / MA50: | +1.60% | |
| Price / MA100: | +7.66% | |
| Price / MAexp7: | -0.98% | |
| Price / MAexp20: | -0.70% | |
| Price / MAexp50: | +1.89% | |
| Price / MAexp100: | +6.14% |
News
The latest news and videos published on IBERDROLA at the time of the analysis were as follows:
- Havfram awarded contract by Iberdrola for Windanker project
- Havfram awarded contract by Iberdrola for Windanker project
- IBERDROLA NOW USING GENERAC GRID SERVICES' CONCERTO™ TO SUPPORT GRID STABILITY
- Massive Shareholder Support for Management of AVANGRID’s Parent Company Iberdrola in a Record Year for the Company
- Ernest Moniz Presents World Jurist Association Medal of Honor to Ignacio Galán, Executive Chairman of Iberdrola and Chairman of AVANGRID
About author
Online


Add a comment
Comments
0 comments on the analysis IBERDROLA - Daily