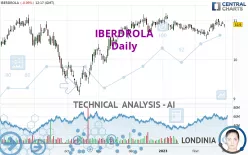
IBERDROLA - Daily - Technical analysis published on 02/28/2023 (GMT)
- 251
- 0
Click here for a new analysis!
- Timeframe : Daily
- - Analysis generated on
- Status : LEVEL MAINTAINED

Summary of the analysis

Additional analysis
Quotes
IBERDROLA rating 10.900 EUR. The price registered a decrease of -0.09% on the session and was between 10.820 EUR and 10.905 EUR. This implies that the price is at +0.74% from its lowest and at -0.05% from its highest.The Central Gaps scanner detects the formation of a bearish gap marking the strong presence of sellers ahead of buyers at the opening. This formed a quotation gap.
Opening Gap DOWN
Type : Bearish
Timeframe : Openning
Here is a more detailed summary of the historical variations registered by IBERDROLA:
Near a new HIGH record (5 years)
Type : Bullish
Timeframe : Weekly
Near a new HIGH record (1 year)
Type : Bullish
Timeframe : Weekly
Near a new LOW record (1st january)
Type : Bearish
Timeframe : Weekly
Near a new LOW record (1 month)
Type : Bearish
Timeframe : Weekly
Technical
Technical analysis of IBERDROLA in Daily shows a strongly overall bullish trend. The signals given by the moving averages are 89.29% bullish. This strong bullish trend is confirmed by the strong signals currently being given by short-term moving averages. There is no crossing of moving average by the price or crossing of moving averages between themselves.
An assessment of technical indicators shows a moderate bullish signal.
The Central Indicators scanner found this result concerning these indicators:
Price is back under the pivot point
Type : Bearish
Timeframe : Weekly
No signals are given by Central Patterns, a market scanner specialised in chart patterns, resistances and supports.
No result was found by the Central Candlesticks scanner on Japanese candlesticks.
| S3 | S2 | S1 | Price | R1 | R2 | |
|---|---|---|---|---|---|---|
| ProTrendLines | 9.553 | 10.215 | 10.621 | 10.900 | 10.927 | 11.336 |
| Change (%) | -12.36% | -6.28% | -2.56% | - | +0.25% | +4.00% |
| Change | -1.347 | -0.685 | -0.279 | - | +0.027 | +0.436 |
| Level | Minor | Minor | Major | - | Major | Minor |
Pivot points can also be used to set your price objectives. Here is the price situation in relation to pivot points:
| Pivot points | S3 | S2 | S1 | PP | R1 | R2 | R3 |
|---|---|---|---|---|---|---|---|
| Standard | 10.817 | 10.863 | 10.887 | 10.933 | 10.957 | 11.003 | 11.027 |
| Camarilla | 10.891 | 10.897 | 10.904 | 10.910 | 10.916 | 10.923 | 10.929 |
| Woodie | 10.805 | 10.858 | 10.875 | 10.928 | 10.945 | 10.998 | 11.015 |
| Fibonacci | 10.863 | 10.890 | 10.907 | 10.933 | 10.960 | 10.977 | 11.003 |
| Pivot points | S3 | S2 | S1 | PP | R1 | R2 | R3 |
|---|---|---|---|---|---|---|---|
| Standard | 10.615 | 10.730 | 10.810 | 10.925 | 11.005 | 11.120 | 11.200 |
| Camarilla | 10.836 | 10.854 | 10.872 | 10.890 | 10.908 | 10.926 | 10.944 |
| Woodie | 10.598 | 10.721 | 10.793 | 10.916 | 10.988 | 11.111 | 11.183 |
| Fibonacci | 10.730 | 10.805 | 10.851 | 10.925 | 11.000 | 11.046 | 11.120 |
| Pivot points | S3 | S2 | S1 | PP | R1 | R2 | R3 |
|---|---|---|---|---|---|---|---|
| Standard | 10.334 | 10.520 | 10.632 | 10.818 | 10.930 | 11.116 | 11.228 |
| Camarilla | 10.663 | 10.690 | 10.718 | 10.745 | 10.772 | 10.800 | 10.827 |
| Woodie | 10.298 | 10.502 | 10.596 | 10.800 | 10.894 | 11.098 | 11.192 |
| Fibonacci | 10.520 | 10.634 | 10.704 | 10.818 | 10.932 | 11.002 | 11.116 |
Numerical data
The following is the status of technical indicators and moving averages registered at the time this technical analysis was created:
| RSI (14): | 56.83 | |
| MACD (12,26,9): | 0.0410 | |
| Directional Movement: | -1.550 | |
| AROON (14): | 50.000 | |
| DEMA (21): | 10.889 | |
| Parabolic SAR (0,02-0,02-0,2): | 10.794 | |
| Elder Ray (13): | -0.005 | |
| Super Trend (3,10): | 10.553 | |
| Zig ZAG (10): | 10.890 | |
| VORTEX (21): | 1.0040 | |
| Stochastique (14,3,5): | 72.17 | |
| TEMA (21): | 10.906 | |
| Williams %R (14): | -29.13 | |
| Chande Momentum Oscillator (20): | 0.275 | |
| Repulse (5,40,3): | 0.0050 | |
| ROCnROLL: | 1 | |
| TRIX (15,9): | 0.0290 | |
| Courbe Coppock: | 4.01 |
| MA7: | 10.919 | |
| MA20: | 10.799 | |
| MA50: | 10.809 | |
| MA100: | 10.494 | |
| MAexp7: | 10.895 | |
| MAexp20: | 10.843 | |
| MAexp50: | 10.761 | |
| MAexp100: | 10.599 | |
| Price / MA7: | -0.17% | |
| Price / MA20: | +0.94% | |
| Price / MA50: | +0.84% | |
| Price / MA100: | +3.87% | |
| Price / MAexp7: | +0.05% | |
| Price / MAexp20: | +0.53% | |
| Price / MAexp50: | +1.29% | |
| Price / MAexp100: | +2.84% |
News
The latest news and videos published on IBERDROLA at the time of the analysis were as follows:
- AVANGRID, Inc.: Ignacio Galán at Harvard Business School discusses company case study with students, “Iberdrola, leading the energy revolution”
- Cummins Selects Spain for its Gigawatt Electrolyzer Plant & Partners with Iberdrola to Lead the Green Hydrogen Value Chain
- Cummins and Iberdrola to Announce Hydrogen Opportunities in Spain
- Mitsubishi Power and Iberdrola to promote renewable solutions aimed at decarbonizing industry
- Iberdrola chooses MiX Telematics as its long-term global connected fleet partner
About author
Online


Add a comment
Comments
0 comments on the analysis IBERDROLA - Daily