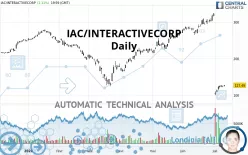
IAC INC. - Daily - Technical analysis published on 07/11/2020 (GMT)
- 375
- 0
- Who voted?
Click here for a new analysis!
- Timeframe : Daily
- - Analysis generated on
- Status : INVALID

Summary of the analysis

Additional analysis
Quotes
The IAC/INTERACTIVECORP rating is 127.49 USD. The price registered an increase of +2.12% on the session and was traded between 124.38 USD and 127.95 USD over the period. The price is currently at +2.50% from its lowest and -0.36% from its highest.A bearish opening was detected by the Central Gaps scanner. Sellers are trying to impose a bearish trend in the very short term.
Bearish opening
Type : Bearish
Timeframe : Openning
A study of price movements over other periods shows the following variations:
Abnormal volumes
Timeframe : 5 days
Abnormal volumes
Timeframe : 20 days
Technical
Technical analysis of IAC/INTERACTIVECORP in Daily shows a overall strongly bearish trend. 85.71% of the signals given by moving averages are bearish. This strongly bearish trend is supported by the strong bearish signals given by short-term moving averages. There is no crossing of moving average by the price or crossing of moving averages between themselves.
In fact, according to the parameters integrated into the Central Analyzer system, only 9 technical indicators out of 18 analysed are currently bearish. But beware of excesses. The Central Indicators scanner currently detects this:
RSI indicator is oversold : under 30
Type : Neutral
Timeframe : Daily
CCI indicator is oversold : under -100
Type : Neutral
Timeframe : Daily
RSI indicator: bullish divergence
Type : Bullish
Timeframe : Daily
Williams %R indicator is oversold : under -80
Type : Neutral
Timeframe : Daily
Pivot points : price is over resistance 1
Type : Neutral
Timeframe : Daily
Price is back under the pivot point
Type : Bearish
Timeframe : Weekly
No signals are given by Central Patterns, a market scanner specialised in chart patterns, resistances and supports.
For a small rebound in the very short term, the Central Candlesticks scanner currently notes the presence of this bullish pattern in Japanese candlesticks:
Bullish harami
Type : Bullish
Timeframe : Daily
| S2 | S1 | Price | R1 | R2 | R3 | |
|---|---|---|---|---|---|---|
| ProTrendLines | 76.82 | 100.94 | 127.49 | 130.71 | 165.88 | 212.75 |
| Change (%) | -39.74% | -20.83% | - | +2.53% | +30.11% | +66.88% |
| Change | -50.67 | -26.55 | - | +3.22 | +38.39 | +85.26 |
| Level | Intermediate | Major | - | Major | Intermediate | Intermediate |
Pivot points can also be used to set your price objectives. Here is the price situation in relation to pivot points:
| Pivot points | S3 | S2 | S1 | PP | R1 | R2 | R3 |
|---|---|---|---|---|---|---|---|
| Standard | 118.41 | 120.23 | 122.54 | 124.35 | 126.66 | 128.48 | 130.79 |
| Camarilla | 123.72 | 124.09 | 124.47 | 124.85 | 125.23 | 125.61 | 125.98 |
| Woodie | 118.66 | 120.35 | 122.79 | 124.48 | 126.91 | 128.60 | 131.04 |
| Fibonacci | 120.23 | 121.80 | 122.78 | 124.35 | 125.93 | 126.90 | 128.48 |
| Pivot points | S3 | S2 | S1 | PP | R1 | R2 | R3 |
|---|---|---|---|---|---|---|---|
| Standard | -190.11 | -44.95 | 34.41 | 179.57 | 258.93 | 404.09 | 483.45 |
| Camarilla | 52.02 | 72.60 | 93.18 | 113.76 | 134.34 | 154.92 | 175.50 |
| Woodie | -223.02 | -61.40 | 1.50 | 163.12 | 226.02 | 387.64 | 450.54 |
| Fibonacci | -44.95 | 40.82 | 93.81 | 179.57 | 265.34 | 318.33 | 404.09 |
| Pivot points | S3 | S2 | S1 | PP | R1 | R2 | R3 |
|---|---|---|---|---|---|---|---|
| Standard | 223.91 | 244.35 | 283.87 | 304.31 | 343.83 | 364.27 | 403.79 |
| Camarilla | 306.91 | 312.41 | 317.90 | 323.40 | 328.90 | 334.39 | 339.89 |
| Woodie | 233.46 | 249.12 | 293.42 | 309.08 | 353.38 | 369.04 | 413.34 |
| Fibonacci | 244.35 | 267.25 | 281.40 | 304.31 | 327.21 | 341.36 | 364.27 |
Numerical data
The following are the details of the technical indicators and moving averages that were collected to generate this technical analysis:
| RSI (14): | 25.60 | |
| MACD (12,26,9): | -39.9100 | |
| Directional Movement: | -37.52 | |
| AROON (14): | -7.14 | |
| DEMA (21): | 164.78 | |
| Parabolic SAR (0,02-0,02-0,2): | 303.17 | |
| Elder Ray (13): | -56.96 | |
| Super Trend (3,10): | 186.19 | |
| Zig ZAG (10): | 127.49 | |
| VORTEX (21): | 1.0800 | |
| Stochastique (14,3,5): | 11.07 | |
| TEMA (21): | 124.27 | |
| Williams %R (14): | -87.85 | |
| Chande Momentum Oscillator (20): | -175.63 | |
| Repulse (5,40,3): | 6.1300 | |
| ROCnROLL: | 2 | |
| TRIX (15,9): | -1.0600 | |
| Courbe Coppock: | 100.84 |
| MA7: | 120.64 | |
| MA20: | 236.43 | |
| MA50: | 248.21 | |
| MA100: | 220.87 | |
| MAexp7: | 148.31 | |
| MAexp20: | 206.97 | |
| MAexp50: | 231.82 | |
| MAexp100: | 231.83 | |
| Price / MA7: | +5.68% | |
| Price / MA20: | -46.08% | |
| Price / MA50: | -48.64% | |
| Price / MA100: | -42.28% | |
| Price / MAexp7: | -14.04% | |
| Price / MAexp20: | -38.40% | |
| Price / MAexp50: | -45.00% | |
| Price / MAexp100: | -45.01% |
News
Don"t forget to follow the news on IAC/INTERACTIVECORP. At the time of publication of this analysis, the latest news was as follows:
- IAC/InterActiveCorp Commences Tender Offer For All Outstanding Shares Of Care.com, Inc.
- IAC/INTERACTIVECORP INVESTIGATION INITIATED BY FORMER LOUISIANA ATTORNEY GENERAL: Kahn Swick & Foti, LLC Investigates the Officers and Directors of IAC/InterActiveCorp - IAC
-
 IAC InterActiveCorp
- Class Action Lawsuit Alleges RICO Violations By IAC/InteractiveCorp (NASDAQ: IAC) and HomeAdvisor
About author

Online


Add a comment
Comments
0 comments on the analysis IAC INC. - Daily