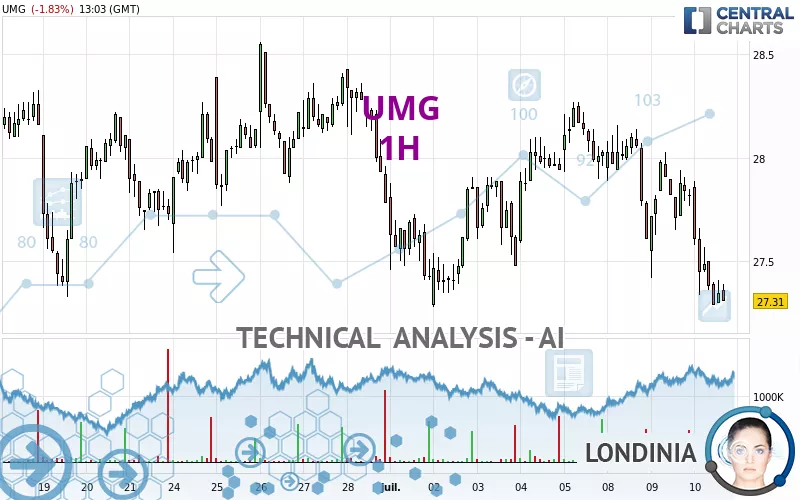
UMG - 1H - Technical analysis published on 07/10/2024 (GMT)
- 147
- 0
Click here for a new analysis!
- Timeframe : 1H
- - Analysis generated on
- Status : LEVEL MAINTAINED
Summary of the analysis

Additional analysis
Quotes
UMG rating 27.36 EUR. The price is lower by -1.65% since the last closing with the lowest point at 27.29 EUR and the highest point at 27.89 EUR. The deviation from the price is +0.26% for the low point and -1.90% for the high point.The Central Gaps scanner detects a bullish opening. A small advantage for buyers in the very short term.
Bullish opening
Type : Bullish
Timeframe : Openning
So that you have an overall view of the price change, here is a table showing the variations over several periods:
Near a new HIGH record (5 years)
Type : Bullish
Timeframe : Weekly
Near a new HIGH record (1 year)
Type : Bullish
Timeframe : Weekly
Near a new HIGH record (1st january)
Type : Bullish
Timeframe : Weekly
Near a new HIGH record (1 month)
Type : Bullish
Timeframe : Weekly
Technical
A technical analysis in 1H of this UMG chart shows a sharp bearish trend. 92.86% of the signals given by moving averages are bearish. This strongly bearish trend is supported by the strong bearish signals given by short-term moving averages. The Central Indicators scanner does not detect any result on moving averages that would impact this trend.
An assessment of technical indicators shows a bearish signal.
But beware of excesses. The Central Indicators scanner currently detects this:
CCI indicator is oversold : under -100
Type : Neutral
Timeframe : 1 hour
CCI indicator: bullish divergence
Type : Bullish
Timeframe : 1 hour
RSI indicator: bullish divergence
Type : Bullish
Timeframe : 1 hour
Williams %R indicator is oversold : under -80
Type : Neutral
Timeframe : 1 hour
Pivot points : price is under support 1
Type : Neutral
Timeframe : 1 hour
Pivot points : price is under support 1
Type : Neutral
Timeframe : Weekly
An analysis of the price chart with the Central Patterns scanner (detector of chart patterns and resistances and supports) shows several results that can have an impact on the price change:
Near horizontal support
Type : Bullish
Timeframe : 1 hour
Support of channel is broken
Type : Bearish
Timeframe : 1 hour
For a small rebound in the very short term, the Central Candlesticks scanner currently notes the presence of this bullish pattern in Japanese candlesticks:
Bullish harami
Type : Bullish
Timeframe : 1 hour
| S3 | S2 | S1 | Price | R1 | R2 | R3 | |
|---|---|---|---|---|---|---|---|
| ProTrendLines | 23.19 | 24.08 | 26.53 | 27.36 | 27.43 | 27.81 | 28.03 |
| Change (%) | -15.24% | -11.99% | -3.03% | - | +0.26% | +1.64% | +2.45% |
| Change | -4.17 | -3.28 | -0.83 | - | +0.07 | +0.45 | +0.67 |
| Level | Major | Minor | Intermediate | - | Major | Minor | Intermediate |
To determine price objectives, it is also possible to use the pivot points. Here is the price position in relation to pivot points:
| Pivot points | S3 | S2 | S1 | PP | R1 | R2 | R3 |
|---|---|---|---|---|---|---|---|
| Standard | 26.87 | 27.15 | 27.48 | 27.76 | 28.09 | 28.37 | 28.70 |
| Camarilla | 27.65 | 27.71 | 27.76 | 27.82 | 27.88 | 27.93 | 27.99 |
| Woodie | 26.91 | 27.16 | 27.52 | 27.77 | 28.13 | 28.38 | 28.74 |
| Fibonacci | 27.15 | 27.38 | 27.52 | 27.76 | 27.99 | 28.13 | 28.37 |
| Pivot points | S3 | S2 | S1 | PP | R1 | R2 | R3 |
|---|---|---|---|---|---|---|---|
| Standard | 26.46 | 26.87 | 27.45 | 27.86 | 28.44 | 28.85 | 29.43 |
| Camarilla | 27.76 | 27.85 | 27.94 | 28.03 | 28.12 | 28.21 | 28.30 |
| Woodie | 26.55 | 26.91 | 27.54 | 27.90 | 28.53 | 28.89 | 29.52 |
| Fibonacci | 26.87 | 27.25 | 27.48 | 27.86 | 28.24 | 28.47 | 28.85 |
| Pivot points | S3 | S2 | S1 | PP | R1 | R2 | R3 |
|---|---|---|---|---|---|---|---|
| Standard | 25.06 | 26.19 | 26.99 | 28.12 | 28.92 | 30.05 | 30.85 |
| Camarilla | 27.25 | 27.43 | 27.60 | 27.78 | 27.96 | 28.13 | 28.31 |
| Woodie | 24.89 | 26.11 | 26.82 | 28.04 | 28.75 | 29.97 | 30.68 |
| Fibonacci | 26.19 | 26.93 | 27.39 | 28.12 | 28.86 | 29.32 | 30.05 |
Numerical data
The following are the details of the technical indicators and moving averages that were collected to generate this technical analysis:
| RSI (14): | 35.22 | |
| MACD (12,26,9): | -0.1500 | |
| Directional Movement: | -25.48 | |
| AROON (14): | -71.43 | |
| DEMA (21): | 27.51 | |
| Parabolic SAR (0,02-0,02-0,2): | 27.96 | |
| Elder Ray (13): | -0.24 | |
| Super Trend (3,10): | 27.84 | |
| Zig ZAG (10): | 27.32 | |
| VORTEX (21): | 0.8000 | |
| Stochastique (14,3,5): | 5.09 | |
| TEMA (21): | 27.38 | |
| Williams %R (14): | -91.89 | |
| Chande Momentum Oscillator (20): | -0.62 | |
| Repulse (5,40,3): | -0.6900 | |
| ROCnROLL: | 2 | |
| TRIX (15,9): | -0.0500 | |
| Courbe Coppock: | 2.79 |
| MA7: | 27.73 | |
| MA20: | 27.99 | |
| MA50: | 28.25 | |
| MA100: | 27.59 | |
| MAexp7: | 27.47 | |
| MAexp20: | 27.67 | |
| MAexp50: | 27.80 | |
| MAexp100: | 27.88 | |
| Price / MA7: | -1.33% | |
| Price / MA20: | -2.25% | |
| Price / MA50: | -3.15% | |
| Price / MA100: | -0.83% | |
| Price / MAexp7: | -0.40% | |
| Price / MAexp20: | -1.12% | |
| Price / MAexp50: | -1.58% | |
| Price / MAexp100: | -1.87% |
News
Don't forget to follow the news on UMG. At the time of publication of this analysis, the latest news was as follows:
- Scinai to showcase its novel biological local therapeutic for Plaque Psoriasis at Dermatology Drug Development Summit together with Prof. Michael Schön of UMG
- UMG ANNOUNCES MAJORITY INVESTMENT IN ICONIC AFROBEATS LABEL MAVIN GLOBAL, ACCELERATING EXPANSION OF AFRICA'S OUTSTANDING CREATIVE PLATFORM
- Psychedelia And Blues-Infused Alt-Rock Up And Comers BLUPHORIA Release Self-Titled Debut Album via EDGEOUT Records / UMe / UMG
- BiondVax's Strategic Research Collaboration with Max Planck and UMG: Significant progress towards development of innovative nanosized antibodies (NanoAbs) for therapeutic indications in addition to COVID-19
- Engine Gaming & Media Announces Agreement to Divest Assets of UMG Gaming Subsidiary to Harena Data
About author
Online


Add a comment
Comments
0 comments on the analysis UMG - 1H