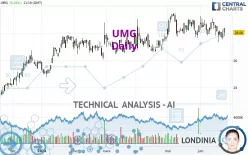
UMG - Daily - Technical analysis published on 06/25/2024 (GMT)
- 183
- 0
Click here for a new analysis!
- Timeframe : Daily
- - Analysis generated on
- Status : INVALID

Summary of the analysis

Additional analysis
Quotes
The UMG rating is 28.06 EUR. The price registered an increase of +0.29% on the session and was between 27.77 EUR and 28.39 EUR. This implies that the price is at +1.04% from its lowest and at -1.16% from its highest.The Central Gaps scanner detects the formation of a bullish gap marking the strong presence of buyers against sellers at the opening. This formed a quotation gap.
Opening Gap UP
Type : Bullish
Timeframe : Openning
A study of price movements over other periods shows the following variations:
Near a new HIGH record (5 years)
Type : Bullish
Timeframe : Weekly
Near a new HIGH record (1 year)
Type : Bullish
Timeframe : Weekly
Near a new HIGH record (1st january)
Type : Bullish
Timeframe : Weekly
Near a new HIGH record (1 month)
Type : Bullish
Timeframe : Weekly
Technical
A technical analysis in Daily of this UMG chart shows a bullish trend. The signals given by moving averages are 71.43% bullish. This bullish trend could slow down given the neutral signals currently being given by short-term moving averages. The Central Indicators market scanner is currently detecting a bullish signal that could impact this trend:
Bullish price crossover with adaptative moving average 20
Type : Bullish
Timeframe : Daily
Technical indicators are slightly bearish. There is therefore considerable uncertainty about the continuation of the decline.
Central Indicators, the scanner specialised in technical indicators, has identified this signal:
Price is back over the pivot point
Type : Bullish
Timeframe : Weekly
No signals are given by Central Patterns, a market scanner specialised in chart patterns, resistances and supports.
The Central Candlesticks scanner, specialised in Japanese candlesticks, did not identify any signals.
| S3 | S2 | S1 | Price | R1 | R2 | |
|---|---|---|---|---|---|---|
| ProTrendLines | 24.08 | 26.53 | 27.54 | 28.06 | 28.21 | 29.14 |
| Change (%) | -14.18% | -5.45% | -1.85% | - | +0.53% | +3.85% |
| Change | -3.98 | -1.53 | -0.52 | - | +0.15 | +1.08 |
| Level | Minor | Intermediate | Major | - | Major | Major |
Pivot points can also be used to set your price objectives. Here is the price situation in relation to pivot points:
| Pivot points | S3 | S2 | S1 | PP | R1 | R2 | R3 |
|---|---|---|---|---|---|---|---|
| Standard | 26.86 | 27.20 | 27.59 | 27.93 | 28.32 | 28.66 | 29.05 |
| Camarilla | 27.78 | 27.85 | 27.91 | 27.98 | 28.05 | 28.11 | 28.18 |
| Woodie | 26.89 | 27.21 | 27.62 | 27.94 | 28.35 | 28.67 | 29.08 |
| Fibonacci | 27.20 | 27.48 | 27.65 | 27.93 | 28.21 | 28.38 | 28.66 |
| Pivot points | S3 | S2 | S1 | PP | R1 | R2 | R3 |
|---|---|---|---|---|---|---|---|
| Standard | 25.90 | 26.62 | 27.17 | 27.89 | 28.44 | 29.16 | 29.71 |
| Camarilla | 27.38 | 27.50 | 27.61 | 27.73 | 27.85 | 27.96 | 28.08 |
| Woodie | 25.83 | 26.58 | 27.10 | 27.85 | 28.37 | 29.12 | 29.64 |
| Fibonacci | 26.62 | 27.10 | 27.40 | 27.89 | 28.37 | 28.67 | 29.16 |
| Pivot points | S3 | S2 | S1 | PP | R1 | R2 | R3 |
|---|---|---|---|---|---|---|---|
| Standard | 25.81 | 26.61 | 27.60 | 28.40 | 29.39 | 30.19 | 31.18 |
| Camarilla | 28.09 | 28.25 | 28.42 | 28.58 | 28.74 | 28.91 | 29.07 |
| Woodie | 25.90 | 26.66 | 27.69 | 28.45 | 29.48 | 30.24 | 31.27 |
| Fibonacci | 26.61 | 27.30 | 27.72 | 28.40 | 29.09 | 29.51 | 30.19 |
Numerical data
The following is the status of technical indicators and moving averages registered at the time this technical analysis was created:
| RSI (14): | 47.13 | |
| MACD (12,26,9): | -0.0500 | |
| Directional Movement: | -6.92 | |
| AROON (14): | -28.57 | |
| DEMA (21): | 28.22 | |
| Parabolic SAR (0,02-0,02-0,2): | 28.65 | |
| Elder Ray (13): | -0.10 | |
| Super Trend (3,10): | 27.46 | |
| Zig ZAG (10): | 28.03 | |
| VORTEX (21): | 0.9100 | |
| Stochastique (14,3,5): | 32.77 | |
| TEMA (21): | 28.00 | |
| Williams %R (14): | -60.67 | |
| Chande Momentum Oscillator (20): | -0.20 | |
| Repulse (5,40,3): | -0.9300 | |
| ROCnROLL: | -1 | |
| TRIX (15,9): | 0.0200 | |
| Courbe Coppock: | 2.39 |
| MA7: | 28.04 | |
| MA20: | 28.30 | |
| MA50: | 28.05 | |
| MA100: | 27.49 | |
| MAexp7: | 28.07 | |
| MAexp20: | 28.23 | |
| MAexp50: | 28.02 | |
| MAexp100: | 27.41 | |
| Price / MA7: | +0.07% | |
| Price / MA20: | -0.85% | |
| Price / MA50: | +0.04% | |
| Price / MA100: | +2.07% | |
| Price / MAexp7: | -0.04% | |
| Price / MAexp20: | -0.60% | |
| Price / MAexp50: | +0.14% | |
| Price / MAexp100: | +2.37% |
News
Don't forget to follow the news on UMG. At the time of publication of this analysis, the latest news was as follows:
- Scinai to showcase its novel biological local therapeutic for Plaque Psoriasis at Dermatology Drug Development Summit together with Prof. Michael Schön of UMG
- UMG ANNOUNCES MAJORITY INVESTMENT IN ICONIC AFROBEATS LABEL MAVIN GLOBAL, ACCELERATING EXPANSION OF AFRICA'S OUTSTANDING CREATIVE PLATFORM
- Psychedelia And Blues-Infused Alt-Rock Up And Comers BLUPHORIA Release Self-Titled Debut Album via EDGEOUT Records / UMe / UMG
- BiondVax's Strategic Research Collaboration with Max Planck and UMG: Significant progress towards development of innovative nanosized antibodies (NanoAbs) for therapeutic indications in addition to COVID-19
- Engine Gaming & Media Announces Agreement to Divest Assets of UMG Gaming Subsidiary to Harena Data
About author
Online


Add a comment
Comments
0 comments on the analysis UMG - Daily