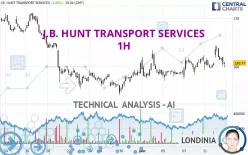
J.B. HUNT TRANSPORT SERVICES - 1H - Technical analysis published on 06/12/2024 (GMT)
- 123
- 0
Click here for a new analysis!
- Timeframe : 1H
- - Analysis generated on
- Status : INVALID

Summary of the analysis

Additional analysis
Quotes
The J.B. HUNT TRANSPORT SERVICES rating is 160.47 USD. The price is lower by -0.11% since the last closing and was traded between 159.88 USD and 164.35 USD over the period. The price is currently at +0.37% from its lowest and -2.36% from its highest.The Central Gaps scanner detects the formation of a bullish gap marking the strong presence of buyers against sellers at the opening. This formed a quotation gap.
Opening Gap UP
Type : Bullish
Timeframe : Openning
A study of price movements over other periods shows the following variations:
Near a new LOW record (1 year)
Type : Bearish
Timeframe : Weekly
Near a new LOW record (1st january)
Type : Bearish
Timeframe : Weekly
Near a new HIGH record (1 month)
Type : Bullish
Timeframe : Weekly
Technical
A technical analysis in 1H of this J.B. HUNT TRANSPORT SERVICES chart shows a bullish trend. 71.43% of the signals given by moving averages are bullish. Caution: the neutral signals currently given by short-term moving averages show us that the global trend is losing momentum. An assessment of moving averages reveals several bearish signals that could impact this trend:
Bearish trend reversal : adaptative moving average 20
Type : Bearish
Timeframe : 1 hour
Bearish price crossover with adaptative moving average 20
Type : Bearish
Timeframe : 1 hour
In fact, according to the parameters integrated into the Central Analyzer system, only 8 technical indicators out of 18 analysed are currently bearish. But beware of excesses. The Central Indicators scanner currently detects this:
Williams %R indicator is oversold : under -80
Type : Neutral
Timeframe : 1 hour
Price is back over the pivot point
Type : Bullish
Timeframe : Weekly
Momentum indicator is back under 0
Type : Bearish
Timeframe : 1 hour
The Central Patterns scanner, which studies chart patterns, resistances and supports, has identified this signal:
Near support of channel
Type : Bullish
Timeframe : 1 hour
No result was found by the Central Candlesticks scanner on Japanese candlesticks.
| S3 | S2 | S1 | Price | R1 | R2 | R3 | |
|---|---|---|---|---|---|---|---|
| ProTrendLines | 155.43 | 157.28 | 159.31 | 160.47 | 164.27 | 166.95 | 169.01 |
| Change (%) | -3.14% | -1.99% | -0.72% | - | +2.37% | +4.04% | +5.32% |
| Change | -5.04 | -3.19 | -1.16 | - | +3.80 | +6.48 | +8.54 |
| Level | Minor | Minor | Intermediate | - | Major | Intermediate | Minor |
Pivot points can also be used to set your price objectives. Here is the price situation in relation to pivot points:
| Pivot points | S3 | S2 | S1 | PP | R1 | R2 | R3 |
|---|---|---|---|---|---|---|---|
| Standard | 157.06 | 158.20 | 159.42 | 160.56 | 161.78 | 162.92 | 164.14 |
| Camarilla | 159.99 | 160.21 | 160.42 | 160.64 | 160.86 | 161.07 | 161.29 |
| Woodie | 157.10 | 158.22 | 159.46 | 160.58 | 161.82 | 162.94 | 164.18 |
| Fibonacci | 158.20 | 159.10 | 159.66 | 160.56 | 161.46 | 162.02 | 162.92 |
| Pivot points | S3 | S2 | S1 | PP | R1 | R2 | R3 |
|---|---|---|---|---|---|---|---|
| Standard | 150.58 | 153.85 | 156.91 | 160.18 | 163.24 | 166.51 | 169.57 |
| Camarilla | 158.22 | 158.80 | 159.38 | 159.96 | 160.54 | 161.12 | 161.70 |
| Woodie | 150.47 | 153.80 | 156.80 | 160.13 | 163.13 | 166.46 | 169.46 |
| Fibonacci | 153.85 | 156.27 | 157.77 | 160.18 | 162.60 | 164.10 | 166.51 |
| Pivot points | S3 | S2 | S1 | PP | R1 | R2 | R3 |
|---|---|---|---|---|---|---|---|
| Standard | 134.27 | 144.18 | 152.47 | 162.38 | 170.67 | 180.58 | 188.87 |
| Camarilla | 155.75 | 157.41 | 159.08 | 160.75 | 162.42 | 164.09 | 165.76 |
| Woodie | 133.45 | 143.78 | 151.65 | 161.98 | 169.85 | 180.18 | 188.05 |
| Fibonacci | 144.18 | 151.14 | 155.43 | 162.38 | 169.34 | 173.63 | 180.58 |
Numerical data
The following are the details of the technical indicators and moving averages that were collected to generate this technical analysis:
| RSI (14): | 49.13 | |
| MACD (12,26,9): | 0.3800 | |
| Directional Movement: | -0.76 | |
| AROON (14): | 50.00 | |
| DEMA (21): | 161.66 | |
| Parabolic SAR (0,02-0,02-0,2): | 164.27 | |
| Elder Ray (13): | -0.72 | |
| Super Trend (3,10): | 159.83 | |
| Zig ZAG (10): | 160.69 | |
| VORTEX (21): | 0.9500 | |
| Stochastique (14,3,5): | 30.37 | |
| TEMA (21): | 161.49 | |
| Williams %R (14): | -84.48 | |
| Chande Momentum Oscillator (20): | -1.14 | |
| Repulse (5,40,3): | -1.2100 | |
| ROCnROLL: | 2 | |
| TRIX (15,9): | 0.0400 | |
| Courbe Coppock: | 0.54 |
| MA7: | 159.89 | |
| MA20: | 160.50 | |
| MA50: | 168.59 | |
| MA100: | 185.89 | |
| MAexp7: | 161.13 | |
| MAexp20: | 161.11 | |
| MAexp50: | 160.39 | |
| MAexp100: | 160.41 | |
| Price / MA7: | +0.36% | |
| Price / MA20: | -0.02% | |
| Price / MA50: | -4.82% | |
| Price / MA100: | -13.67% | |
| Price / MAexp7: | -0.41% | |
| Price / MAexp20: | -0.40% | |
| Price / MAexp50: | +0.05% | |
| Price / MAexp100: | +0.04% |
News
The last news published on J.B. HUNT TRANSPORT SERVICES at the time of the generation of this analysis was as follows:
- J.B. Hunt Showcases ESG Advancement in New 2022 Sustainability Report
- J.B. Hunt Transport Services, Inc. Announces Participation in Upcoming Investor Conferences
- J.B. Hunt Transport Services, Inc. Announces Quarterly Dividend
- J.B. Hunt Transport Services, Inc. Reports U.S. GAAP Revenues, Net Earnings and Earnings Per Share for the Second Quarter 2023
- J.B. Hunt’s Workplace Culture Continues to Earn National Recognition From Newsweek
About author
Online


Add a comment
Comments
0 comments on the analysis J.B. HUNT TRANSPORT SERVICES - 1H