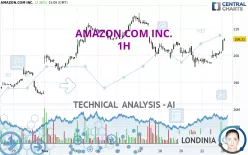
AMAZON.COM INC. - 1H - Technical analysis published on 11/26/2024 (GMT)
- 133
- 0
Click here for a new analysis!
- Timeframe : 1H
- - Analysis generated on
- Status : LEVEL MAINTAINED

Summary of the analysis

Additional analysis
Quotes
The AMAZON.COM INC. price is 206.21 USD. The price registered an increase of +2.36% on the session with the lowest point at 201.79 USD and the highest point at 206.69 USD. The deviation from the price is +2.19% for the low point and -0.23% for the high point.So that you have an overall view of the price change, here is a table showing the variations over several periods:
Technical
Technical analysis of this 1H chart of AMAZON.COM INC. indicates that the overall trend is bullish. 64.29% of the signals given by moving averages are bullish. The overall trend is reinforced by the strong bullish signals from short-term moving averages. The Central Indicators market scanner is currently detecting a bullish signal that could impact this trend:
Bullish trend reversal : adaptative moving average 100
Type : Bullish
Timeframe : 1 hour
In fact, according to the parameters integrated into the Central Analyzer system, 15 technical indicators out of 18 analysed are currently bullish. Caution: the Central Indicators scanner currently detects an excess:
CCI indicator is overbought : over 100
Type : Neutral
Timeframe : 1 hour
Williams %R indicator is overbought : over -20
Type : Neutral
Timeframe : 1 hour
Pivot points : price is over resistance 1
Type : Neutral
Timeframe : Weekly
Pivot points : price is over resistance 3
Type : Neutral
Timeframe : 1 hour
SuperTrend indicator bullish reversal
Type : Bullish
Timeframe : 1 hour
MACD indicator is back over 0
Type : Bullish
Timeframe : 1 hour
An analysis of the price chart with the Central Patterns scanner (detector of chart patterns and resistances and supports) shows several results that can have an impact on the price change:
Near horizontal resistance
Type : Bearish
Timeframe : 1 hour
Resistance of channel is broken
Type : Bullish
Timeframe : 1 hour
No result was found by the Central Candlesticks scanner on Japanese candlesticks.
| S3 | S2 | S1 | Price | R1 | R2 | |
|---|---|---|---|---|---|---|
| ProTrendLines | 191.52 | 195.70 | 200.00 | 206.21 | 206.84 | 214.10 |
| Change (%) | -7.12% | -5.10% | -3.01% | - | +0.31% | +3.83% |
| Change | -14.69 | -10.51 | -6.21 | - | +0.63 | +7.89 |
| Level | Minor | Intermediate | Major | - | Intermediate | Major |
To determine price objectives, it is also possible to use the pivot points. Here is the price position in relation to pivot points:
| Pivot points | S3 | S2 | S1 | PP | R1 | R2 | R3 |
|---|---|---|---|---|---|---|---|
| Standard | 196.70 | 197.85 | 199.65 | 200.80 | 202.60 | 203.75 | 205.55 |
| Camarilla | 200.64 | 200.91 | 201.18 | 201.45 | 201.72 | 201.99 | 202.26 |
| Woodie | 197.03 | 198.01 | 199.98 | 200.96 | 202.93 | 203.91 | 205.88 |
| Fibonacci | 197.85 | 198.98 | 199.67 | 200.80 | 201.93 | 202.62 | 203.75 |
| Pivot points | S3 | S2 | S1 | PP | R1 | R2 | R3 |
|---|---|---|---|---|---|---|---|
| Standard | 183.93 | 189.84 | 193.48 | 199.39 | 203.03 | 208.94 | 212.58 |
| Camarilla | 194.49 | 195.37 | 196.25 | 197.12 | 198.00 | 198.87 | 199.75 |
| Woodie | 182.80 | 189.27 | 192.35 | 198.82 | 201.90 | 208.37 | 211.45 |
| Fibonacci | 189.84 | 193.49 | 195.74 | 199.39 | 203.04 | 205.29 | 208.94 |
| Pivot points | S3 | S2 | S1 | PP | R1 | R2 | R3 |
|---|---|---|---|---|---|---|---|
| Standard | 163.87 | 172.06 | 179.23 | 187.42 | 194.59 | 202.78 | 209.95 |
| Camarilla | 182.18 | 183.58 | 184.99 | 186.40 | 187.81 | 189.22 | 190.62 |
| Woodie | 163.36 | 171.81 | 178.72 | 187.17 | 194.08 | 202.53 | 209.44 |
| Fibonacci | 172.06 | 177.93 | 181.55 | 187.42 | 193.29 | 196.91 | 202.78 |
Numerical data
The following are the details of the technical indicators and moving averages that were collected to generate this technical analysis:
| RSI (14): | 68.01 | |
| MACD (12,26,9): | 0.2500 | |
| Directional Movement: | 20.02 | |
| AROON (14): | 92.86 | |
| DEMA (21): | 200.41 | |
| Parabolic SAR (0,02-0,02-0,2): | 196.57 | |
| Elder Ray (13): | 3.02 | |
| Super Trend (3,10): | 198.24 | |
| Zig ZAG (10): | 205.66 | |
| VORTEX (21): | 0.9800 | |
| Stochastique (14,3,5): | 90.02 | |
| TEMA (21): | 201.73 | |
| Williams %R (14): | -6.01 | |
| Chande Momentum Oscillator (20): | 7.53 | |
| Repulse (5,40,3): | 2.4500 | |
| ROCnROLL: | 1 | |
| TRIX (15,9): | -0.0500 | |
| Courbe Coppock: | 3.09 |
| MA7: | 201.61 | |
| MA20: | 202.63 | |
| MA50: | 193.69 | |
| MA100: | 186.54 | |
| MAexp7: | 201.65 | |
| MAexp20: | 200.45 | |
| MAexp50: | 201.53 | |
| MAexp100: | 201.53 | |
| Price / MA7: | +2.28% | |
| Price / MA20: | +1.77% | |
| Price / MA50: | +6.46% | |
| Price / MA100: | +10.54% | |
| Price / MAexp7: | +2.26% | |
| Price / MAexp20: | +2.87% | |
| Price / MAexp50: | +2.32% | |
| Price / MAexp100: | +2.32% |
News
Don't forget to follow the news on AMAZON.COM INC.. At the time of publication of this analysis, the latest news was as follows:
- Buy with Prime Expands with Launch of New Merchant SteveMadden.com
- Commvault Unveils Clumio Backtrack: Providing Near Instant Recovery of Massive Datasets Stored in Amazon S3
-
 What Are People Buying on Amazon Ahead of Black Friday?
- PeakPicks - New AI Tool That Predicts Future Sales and ROI of Any Product on Amazon Reaches 1000 Users Within a Week
-
Bezos shuts down Musk’s claim that the Amazon founder predicted Trump would lose election #shorts
About author
Online


Add a comment
Comments
0 comments on the analysis AMAZON.COM INC. - 1H