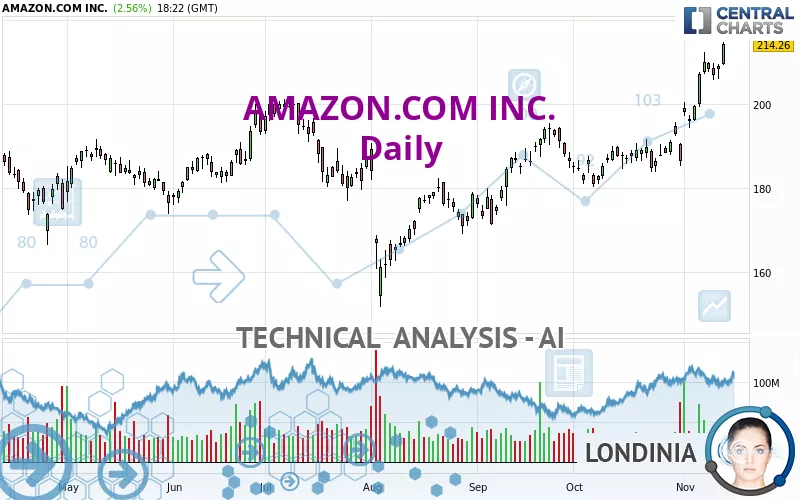
AMAZON.COM INC. - Daily - Technical analysis published on 11/13/2024 (GMT)
- 177
- 0
- Timeframe : Daily
- - Analysis generated on
- Status : WITHOUT TARGET

Summary of the analysis

Additional analysis
Quotes
AMAZON.COM INC. rating 214.26 USD. On the day, this instrument gained +2.56% and was between 209.14 USD and 214.70 USD. This implies that the price is at +2.45% from its lowest and at -0.20% from its highest.A bullish opening was detected by the Central Gaps scanner. Buyers are trying to impose a bullish momentum in the very short term.
Bullish opening
Type : Bullish
Timeframe : Openning
So that you have an overall view of the price change, here is a table showing the variations over several periods:
New HIGH record (5 years)
Type : Bullish
Timeframe : Weekly
New HIGH record (1 year)
Type : Bullish
Timeframe : Weekly
New HIGH record (1st january)
Type : Bullish
Timeframe : Weekly
New HIGH record (1 month)
Type : Bullish
Timeframe : Weekly
Technical
Technical analysis of AMAZON.COM INC. in Daily shows a strongly overall bullish trend. 92.86% of the signals given by moving averages are bullish. This strongly bullish trend is supported by the strong bullish signals given by short-term moving averages. There is no crossing of moving average by the price or crossing of moving averages between themselves.
In fact, 16 technical indicators on 18 studied are currently bullish. Caution: the Central Indicators scanner currently detects an excess:
RSI indicator is overbought : over 70
Type : Neutral
Timeframe : Daily
CCI indicator is overbought : over 100
Type : Neutral
Timeframe : Daily
Williams %R indicator is overbought : over -20
Type : Neutral
Timeframe : Daily
Pivot points : price is over resistance 3
Type : Neutral
Timeframe : Daily
An analysis of the price chart with the Central Patterns scanner (detector of chart patterns and resistances and supports) shows several results that can have an impact on the price change:
Near resistance of channel
Type : Bearish
Timeframe : Daily
Near horizontal support
Type : Bullish
Timeframe : Daily
The Central Candlesticks scanner which studies Japanese candlesticks did not detect anything.
| S3 | S2 | S1 | Price | |
|---|---|---|---|---|
| ProTrendLines | 173.61 | 186.37 | 200.00 | 214.26 |
| Change (%) | -18.97% | -13.02% | -6.66% | - |
| Change | -40.65 | -27.89 | -14.26 | - |
| Level | Minor | Major | Major | - |
To determine price objectives, it is also possible to use the pivot points. Here is the price position in relation to pivot points:
| Pivot points | S3 | S2 | S1 | PP | R1 | R2 | R3 |
|---|---|---|---|---|---|---|---|
| Standard | 203.24 | 204.62 | 206.77 | 208.15 | 210.30 | 211.68 | 213.83 |
| Camarilla | 207.94 | 208.26 | 208.59 | 208.91 | 209.23 | 209.56 | 209.88 |
| Woodie | 203.62 | 204.81 | 207.15 | 208.34 | 210.68 | 211.87 | 214.21 |
| Fibonacci | 204.62 | 205.97 | 206.81 | 208.15 | 209.50 | 210.34 | 211.68 |
| Pivot points | S3 | S2 | S1 | PP | R1 | R2 | R3 |
|---|---|---|---|---|---|---|---|
| Standard | 179.64 | 186.97 | 197.58 | 204.91 | 215.52 | 222.85 | 233.46 |
| Camarilla | 203.25 | 204.89 | 206.54 | 208.18 | 209.83 | 211.47 | 213.11 |
| Woodie | 181.27 | 187.79 | 199.21 | 205.73 | 217.15 | 223.67 | 235.09 |
| Fibonacci | 186.97 | 193.83 | 198.06 | 204.91 | 211.77 | 216.00 | 222.85 |
| Pivot points | S3 | S2 | S1 | PP | R1 | R2 | R3 |
|---|---|---|---|---|---|---|---|
| Standard | 163.87 | 172.06 | 179.23 | 187.42 | 194.59 | 202.78 | 209.95 |
| Camarilla | 182.18 | 183.58 | 184.99 | 186.40 | 187.81 | 189.22 | 190.62 |
| Woodie | 163.36 | 171.81 | 178.72 | 187.17 | 194.08 | 202.53 | 209.44 |
| Fibonacci | 172.06 | 177.93 | 181.55 | 187.42 | 193.29 | 196.91 | 202.78 |
Numerical data
The following are the details of the technical indicators and moving averages that were collected to generate this technical analysis:
| RSI (14): | 72.42 | |
| MACD (12,26,9): | 6.4600 | |
| Directional Movement: | 27.91 | |
| AROON (14): | 100.00 | |
| DEMA (21): | 206.58 | |
| Parabolic SAR (0,02-0,02-0,2): | 192.30 | |
| Elder Ray (13): | 9.33 | |
| Super Trend (3,10): | 197.33 | |
| Zig ZAG (10): | 214.32 | |
| VORTEX (21): | 1.1100 | |
| Stochastique (14,3,5): | 89.32 | |
| TEMA (21): | 210.47 | |
| Williams %R (14): | -1.31 | |
| Chande Momentum Oscillator (20): | 25.92 | |
| Repulse (5,40,3): | 3.7200 | |
| ROCnROLL: | 1 | |
| TRIX (15,9): | 0.3300 | |
| Courbe Coppock: | 20.64 |
| MA7: | 207.83 | |
| MA20: | 196.07 | |
| MA50: | 189.88 | |
| MA100: | 185.94 | |
| MAexp7: | 207.21 | |
| MAexp20: | 198.99 | |
| MAexp50: | 191.69 | |
| MAexp100: | 186.82 | |
| Price / MA7: | +3.09% | |
| Price / MA20: | +9.28% | |
| Price / MA50: | +12.84% | |
| Price / MA100: | +15.23% | |
| Price / MAexp7: | +3.40% | |
| Price / MAexp20: | +7.67% | |
| Price / MAexp50: | +11.77% | |
| Price / MAexp100: | +14.69% |
News
The latest news and videos published on AMAZON.COM INC. at the time of the analysis were as follows:
- The Boys of Riverside by Thomas Fuller Named Amazon’s Best Book of 2024
- Unwrap Millions of Deals During Amazon’s Black Friday Week and Cyber Monday Deal Events Running November 21 through December 2
- REPLY: COVU Transforms Customer Experience with Amazon Connect, Partnering with Storm Reply
- Borealis Foods Reaches Successful Milestone Selling Over 2 Million Units On Amazon
- Blue Duck Capital Sends Open Letter to Amazon Board of Directors
About author

Online


Add a comment
Comments
0 comments on the analysis AMAZON.COM INC. - Daily