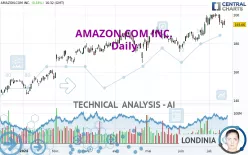
AMAZON.COM INC. - Daily - Technical analysis published on 07/16/2024 (GMT)
- 166
- 0
Click here for a new analysis!
- Timeframe : Daily
- - Analysis generated on
- Status : INVALID

Summary of the analysis

Additional analysis
Quotes
The AMAZON.COM INC. price is 193.06 USD. The price registered an increase of +0.18% on the session and was between 192.75 USD and 196.62 USD. This implies that the price is at +0.16% from its lowest and at -1.81% from its highest.A bullish opening was detected by the Central Gaps scanner. Buyers are trying to impose a bullish momentum in the very short term.
Bullish opening
Type : Bullish
Timeframe : Openning
A study of price movements over other periods shows the following variations:
Near a new HIGH record (5 years)
Type : Bullish
Timeframe : Weekly
Near a new HIGH record (1 year)
Type : Bullish
Timeframe : Weekly
Near a new HIGH record (1st january)
Type : Bullish
Timeframe : Weekly
Near a new HIGH record (1 month)
Type : Bullish
Timeframe : Weekly
Technical
Technical analysis of AMAZON.COM INC. in Daily shows an overall bullish trend. 75.00% of the signals given by moving averages are bullish. Caution: the neutral signals currently given by short-term moving averages show us that the global trend is losing momentum. The Central Indicators scanner detects a bearish signal on moving averages that could impact this trend:
Bearish trend reversal : adaptative moving average 20
Type : Bearish
Timeframe : Daily
On the 18 technical indicators analysed, 3 are bullish, 10 are neutral and 5 are bearish. Central Indicators, the scanner specialised in technical indicators, has identified this signal:
Williams %R indicator is back over -50
Type : Bullish
Timeframe : Daily
Central Patterns, the market scanner focusing on chart patterns, resistances and supports found this result:
Near support of channel
Type : Bullish
Timeframe : Daily
The Central Candlesticks scanner, specialised in Japanese candlesticks, did not identify any signals.
| S3 | S2 | S1 | Price | R1 | |
|---|---|---|---|---|---|
| ProTrendLines | 147.60 | 173.88 | 186.37 | 193.06 | 200.00 |
| Change (%) | -23.55% | -9.93% | -3.47% | - | +3.59% |
| Change | -45.46 | -19.18 | -6.69 | - | +6.94 |
| Level | Major | Intermediate | Major | - | Major |
Pivot points can also be used to set your price objectives. Here is the price situation in relation to pivot points:
| Pivot points | S3 | S2 | S1 | PP | R1 | R2 | R3 |
|---|---|---|---|---|---|---|---|
| Standard | 184.94 | 187.89 | 190.30 | 193.25 | 195.66 | 198.61 | 201.02 |
| Camarilla | 191.25 | 191.74 | 192.23 | 192.72 | 193.21 | 193.70 | 194.19 |
| Woodie | 184.68 | 187.76 | 190.04 | 193.12 | 195.40 | 198.48 | 200.76 |
| Fibonacci | 187.89 | 189.93 | 191.20 | 193.25 | 195.29 | 196.56 | 198.61 |
| Pivot points | S3 | S2 | S1 | PP | R1 | R2 | R3 |
|---|---|---|---|---|---|---|---|
| Standard | 182.83 | 187.84 | 191.17 | 196.18 | 199.51 | 204.52 | 207.85 |
| Camarilla | 192.20 | 192.96 | 193.73 | 194.49 | 195.26 | 196.02 | 196.78 |
| Woodie | 181.98 | 187.42 | 190.32 | 195.76 | 198.66 | 204.10 | 207.00 |
| Fibonacci | 187.84 | 191.03 | 193.00 | 196.18 | 199.37 | 201.34 | 204.52 |
| Pivot points | S3 | S2 | S1 | PP | R1 | R2 | R3 |
|---|---|---|---|---|---|---|---|
| Standard | 155.58 | 165.75 | 179.50 | 189.67 | 203.42 | 213.59 | 227.34 |
| Camarilla | 186.67 | 188.87 | 191.06 | 193.25 | 195.44 | 197.64 | 199.83 |
| Woodie | 157.37 | 166.65 | 181.29 | 190.57 | 205.21 | 214.49 | 229.13 |
| Fibonacci | 165.75 | 174.89 | 180.53 | 189.67 | 198.81 | 204.45 | 213.59 |
Numerical data
The following are the details of the technical indicators and moving averages that were collected to generate this technical analysis:
| RSI (14): | 51.58 | |
| MACD (12,26,9): | 2.6300 | |
| Directional Movement: | 0.88 | |
| AROON (14): | 57.14 | |
| DEMA (21): | 197.17 | |
| Parabolic SAR (0,02-0,02-0,2): | 200.47 | |
| Elder Ray (13): | -0.07 | |
| Super Trend (3,10): | 187.98 | |
| Zig ZAG (10): | 193.29 | |
| VORTEX (21): | 1.1000 | |
| Stochastique (14,3,5): | 50.28 | |
| TEMA (21): | 197.61 | |
| Williams %R (14): | -54.42 | |
| Chande Momentum Oscillator (20): | -4.74 | |
| Repulse (5,40,3): | -3.7100 | |
| ROCnROLL: | -1 | |
| TRIX (15,9): | 0.2700 | |
| Courbe Coppock: | 8.55 |
| MA7: | 196.27 | |
| MA20: | 193.37 | |
| MA50: | 187.85 | |
| MA100: | 183.26 | |
| MAexp7: | 195.06 | |
| MAexp20: | 193.40 | |
| MAexp50: | 188.54 | |
| MAexp100: | 181.60 | |
| Price / MA7: | -1.64% | |
| Price / MA20: | -0.16% | |
| Price / MA50: | +2.77% | |
| Price / MA100: | +5.35% | |
| Price / MAexp7: | -1.03% | |
| Price / MAexp20: | -0.18% | |
| Price / MAexp50: | +2.40% | |
| Price / MAexp100: | +6.31% |
News
The latest news and videos published on AMAZON.COM INC. at the time of the analysis were as follows:
- Kodak Photo Printer, Manufactured By Prinics, Maintains Amazon Bestseller Status: A Timeless Favorite
-
 Saks Fifth Avenue and Amazon team up to buy Neiman Marcus
- Basware Integrates Amazon Business for One-Stop Shopping Experience
-
Amazon tries to fight off discount online retail competitors
-
Can Spotify Outshine YouTube, Amazon, and Apple?
About author

Online


Add a comment
Comments
0 comments on the analysis AMAZON.COM INC. - Daily