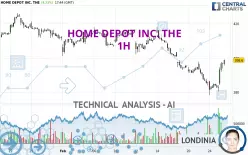
HOME DEPOT INC. THE - 1H - Technical analysis published on 02/25/2025 (GMT)
- 107
- 0
Click here for a new analysis!
- Timeframe : 1H
- - Analysis generated on
- Status : LEVEL MAINTAINED

Summary of the analysis

Additional analysis
Quotes
The HOME DEPOT INC. THE rating is 398.60 USD. The price has increased by +4.23% since the last closing with the lowest point at 384.19 USD and the highest point at 399.01 USD. The deviation from the price is +3.75% for the low point and -0.10% for the high point.A bullish opening was detected by the Central Gaps scanner. Buyers are trying to impose a bullish momentum in the very short term.
Bullish opening
Type : Bullish
Timeframe : Openning
Here is a more detailed summary of the historical variations registered by HOME DEPOT INC. THE:
Near a new LOW record (1st january)
Type : Bearish
Timeframe : Weekly
Near a new LOW record (1 month)
Type : Bearish
Timeframe : Weekly
Technical
A technical analysis in 1H of this HOME DEPOT INC. THE chart shows a slightly bearish trend. Only 57.14% of the signals given by moving averages are bearish. This slightly bearish trend could quickly be reversed due to the strong bullish signals currently being given by short-term moving averages. An assessment of moving averages reveals several bullish signals that could impact this trend:
Bullish price crossover with Moving Average 50
Type : Bullish
Timeframe : 1 hour
Bullish price crossover with adaptative moving average 100
Type : Bullish
Timeframe : 1 hour
In fact, according to the parameters integrated into the Central Analyzer system, 14 technical indicators out of 18 analysed are currently bullish. Caution: the Central Indicators scanner currently detects an excess:
CCI indicator is overbought : over 100
Type : Neutral
Timeframe : 1 hour
Williams %R indicator is overbought : over -20
Type : Neutral
Timeframe : 1 hour
Pivot points : price is over resistance 3
Type : Neutral
Timeframe : 1 hour
Price is back over the pivot point
Type : Bullish
Timeframe : Weekly
An analysis of the price chart with the Central Patterns scanner (detector of chart patterns and resistances and supports) shows several results that can have an impact on the price change:
Near horizontal resistance
Type : Bearish
Timeframe : 1 hour
Resistance of channel is broken
Type : Bullish
Timeframe : 1 hour
For a small rebound in the very short term, the Central Candlesticks scanner currently notes the presence of this bullish pattern in Japanese candlesticks:
Bullish engulfing lines
Type : Bullish
Timeframe : 1 hour
| S3 | S2 | S1 | Price | R1 | R2 | R3 | |
|---|---|---|---|---|---|---|---|
| ProTrendLines | 378.20 | 388.26 | 398.12 | 398.60 | 402.12 | 408.77 | 416.42 |
| Change (%) | -5.12% | -2.59% | -0.12% | - | +0.88% | +2.55% | +4.47% |
| Change | -20.40 | -10.34 | -0.48 | - | +3.52 | +10.17 | +17.82 |
| Level | Intermediate | Major | Minor | - | Minor | Minor | Major |
To determine price objectives, it is also possible to use the pivot points. Here is the price position in relation to pivot points:
| Pivot points | S3 | S2 | S1 | PP | R1 | R2 | R3 |
|---|---|---|---|---|---|---|---|
| Standard | 369.88 | 374.04 | 378.23 | 382.39 | 386.58 | 390.74 | 394.93 |
| Camarilla | 380.12 | 380.89 | 381.66 | 382.42 | 383.19 | 383.95 | 384.72 |
| Woodie | 369.90 | 374.05 | 378.25 | 382.40 | 386.60 | 390.75 | 394.95 |
| Fibonacci | 374.04 | 377.23 | 379.20 | 382.39 | 385.58 | 387.55 | 390.74 |
| Pivot points | S3 | S2 | S1 | PP | R1 | R2 | R3 |
|---|---|---|---|---|---|---|---|
| Standard | 351.54 | 367.72 | 376.51 | 392.69 | 401.48 | 417.66 | 426.45 |
| Camarilla | 378.43 | 380.72 | 383.01 | 385.30 | 387.59 | 389.88 | 392.17 |
| Woodie | 347.85 | 365.87 | 372.82 | 390.84 | 397.79 | 415.81 | 422.76 |
| Fibonacci | 367.72 | 377.26 | 383.15 | 392.69 | 402.23 | 408.12 | 417.66 |
| Pivot points | S3 | S2 | S1 | PP | R1 | R2 | R3 |
|---|---|---|---|---|---|---|---|
| Standard | 339.90 | 360.00 | 385.99 | 406.09 | 432.08 | 452.18 | 478.17 |
| Camarilla | 399.31 | 403.53 | 407.76 | 411.98 | 416.21 | 420.43 | 424.66 |
| Woodie | 342.85 | 361.47 | 388.94 | 407.56 | 435.03 | 453.65 | 481.12 |
| Fibonacci | 360.00 | 377.61 | 388.48 | 406.09 | 423.70 | 434.57 | 452.18 |
Numerical data
The following is the status of technical indicators and moving averages registered at the time this technical analysis was created:
| RSI (14): | 63.66 | |
| MACD (12,26,9): | -0.6300 | |
| Directional Movement: | 9.49 | |
| AROON (14): | 71.43 | |
| DEMA (21): | 388.65 | |
| Parabolic SAR (0,02-0,02-0,2): | 380.03 | |
| Elder Ray (13): | 6.48 | |
| Super Trend (3,10): | 385.99 | |
| Zig ZAG (10): | 398.44 | |
| VORTEX (21): | 1.0400 | |
| Stochastique (14,3,5): | 96.36 | |
| TEMA (21): | 391.48 | |
| Williams %R (14): | -3.22 | |
| Chande Momentum Oscillator (20): | 12.76 | |
| Repulse (5,40,3): | 2.1700 | |
| ROCnROLL: | 1 | |
| TRIX (15,9): | -0.1100 | |
| Courbe Coppock: | 0.73 |
| MA7: | 395.49 | |
| MA20: | 406.65 | |
| MA50: | 402.98 | |
| MA100: | 406.10 | |
| MAexp7: | 392.53 | |
| MAexp20: | 390.63 | |
| MAexp50: | 395.37 | |
| MAexp100: | 400.44 | |
| Price / MA7: | +0.79% | |
| Price / MA20: | -1.98% | |
| Price / MA50: | -1.09% | |
| Price / MA100: | -1.85% | |
| Price / MAexp7: | +1.55% | |
| Price / MAexp20: | +2.04% | |
| Price / MAexp50: | +0.82% | |
| Price / MAexp100: | -0.46% |
News
The last news published on HOME DEPOT INC. THE at the time of the generation of this analysis was as follows:
- The Home Depot Announces Fourth Quarter and Fiscal 2024 Results; Increases Quarterly Dividend by 2.2%; Provides Fiscal 2025 Guidance
- The Home Depot to Host Fourth Quarter & Fiscal Year Earnings Conference Call on February 25
- U.S. SOCCER FEDERATION TEAMS UP WITH THE HOME DEPOT TO BUILD THE FUTURE OF SOCCER
- The Home Depot is Now on DoorDash
- Uber Eats and The Home Depot Team Up to Bring On-Demand and Scheduled Delivery to Customers Nationwide
About author
Online


Add a comment
Comments
0 comments on the analysis HOME DEPOT INC. THE - 1H