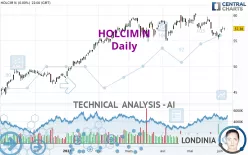
HOLCIM N - Daily - Technical analysis published on 06/07/2023 (GMT)
- 220
- 0
- Timeframe : Daily
- - Analysis generated on
- Status : NEUTRAL

Summary of the analysis

Additional analysis
Quotes
The HOLCIM N rating is 57.5000 CHF. The price has increased by +0.21% since the last closing and was between 56.9400 CHF and 57.5000 CHF. This implies that the price is at +0.98% from its lowest and at 0% from its highest.The Central Gaps scanner detects a bearish opening marking the presence of sellers ahead of buyers at the opening but not sufficiently marked to allow the price to register a quotation gap.
Bearish opening
Type : Bearish
Timeframe : Openning
A study of price movements over other periods shows the following variations:
Near a new HIGH record (5 years)
Type : Bullish
Timeframe : Weekly
Near a new HIGH record (1 month)
Type : Bullish
Timeframe : Weekly
Technical
Technical analysis of HOLCIM N in Daily shows an overall slightly bullish trend. 53.57% of the signals given by moving averages are bullish. As the signals currently given by short-term moving averages are rather neutral, the overall trend could quickly return to neutral as well. The Central Indicators market scanner is currently detecting a bearish signal that could impact this trend:
Bearish trend reversal : Moving Average 50
Type : Bearish
Timeframe : Daily
In fact, according to the parameters integrated into the Central Analyzer system, only 8 technical indicators out of 18 analysed are currently bullish. Central Indicators, the scanner specialised in technical indicators, has identified these signals:
MACD crosses UP its Moving Average
Type : Bullish
Timeframe : Daily
Price is back over the pivot point
Type : Bullish
Timeframe : Daily
An analysis of the price chart with the Central Patterns scanner (detector of chart patterns and resistances and supports) shows a result that can have an impact on the price change:
Near resistance of channel
Type : Bearish
Timeframe : Daily
No result was found by the Central Candlesticks scanner on Japanese candlesticks.
| S3 | S2 | S1 | Price | R1 | R2 | R3 | |
|---|---|---|---|---|---|---|---|
| ProTrendLines | 48.8000 | 55.3320 | 57.0778 | 57.5000 | 59.4400 | 76.9507 | 102.2290 |
| Change (%) | -15.13% | -3.77% | -0.73% | - | +3.37% | +33.83% | +77.79% |
| Change | -8.7000 | -2.1680 | -0.4222 | - | +1.9400 | +19.4507 | +44.7290 |
| Level | Intermediate | Major | Major | - | Major | Intermediate | Minor |
Pivot points can also be used to set your price objectives. Here is the price situation in relation to pivot points:
| Pivot points | S3 | S2 | S1 | PP | R1 | R2 | R3 |
|---|---|---|---|---|---|---|---|
| Standard | 56.5667 | 56.7933 | 57.0867 | 57.3133 | 57.6067 | 57.8333 | 58.1267 |
| Camarilla | 57.2370 | 57.2847 | 57.3323 | 57.3800 | 57.4277 | 57.4753 | 57.5230 |
| Woodie | 56.6000 | 56.8100 | 57.1200 | 57.3300 | 57.6400 | 57.8500 | 58.1600 |
| Fibonacci | 56.7933 | 56.9920 | 57.1147 | 57.3133 | 57.5120 | 57.6347 | 57.8333 |
| Pivot points | S3 | S2 | S1 | PP | R1 | R2 | R3 |
|---|---|---|---|---|---|---|---|
| Standard | 54.0067 | 54.6533 | 55.9467 | 56.5933 | 57.8867 | 58.5333 | 59.8267 |
| Camarilla | 56.7065 | 56.8843 | 57.0622 | 57.2400 | 57.4178 | 57.5957 | 57.7735 |
| Woodie | 54.3300 | 54.8150 | 56.2700 | 56.7550 | 58.2100 | 58.6950 | 60.1500 |
| Fibonacci | 54.6533 | 55.3944 | 55.8523 | 56.5933 | 57.3344 | 57.7923 | 58.5333 |
| Pivot points | S3 | S2 | S1 | PP | R1 | R2 | R3 |
|---|---|---|---|---|---|---|---|
| Standard | 49.0600 | 52.1800 | 54.1600 | 57.2800 | 59.2600 | 62.3800 | 64.3600 |
| Camarilla | 54.7375 | 55.2050 | 55.6725 | 56.1400 | 56.6075 | 57.0750 | 57.5425 |
| Woodie | 48.4900 | 51.8950 | 53.5900 | 56.9950 | 58.6900 | 62.0950 | 63.7900 |
| Fibonacci | 52.1800 | 54.1282 | 55.3318 | 57.2800 | 59.2282 | 60.4318 | 62.3800 |
Numerical data
The following are the details of the technical indicators and moving averages that were collected to generate this technical analysis:
| RSI (14): | 48.85 | |
| MACD (12,26,9): | -0.3249 | |
| Directional Movement: | -2.5638 | |
| AROON (14): | -50.0000 | |
| DEMA (21): | 57.0469 | |
| Parabolic SAR (0,02-0,02-0,2): | 57.7800 | |
| Elder Ray (13): | -0.0481 | |
| Super Trend (3,10): | 58.6081 | |
| Zig ZAG (10): | 57.4400 | |
| VORTEX (21): | 0.9106 | |
| Stochastique (14,3,5): | 48.71 | |
| TEMA (21): | 56.7182 | |
| Williams %R (14): | -51.14 | |
| Chande Momentum Oscillator (20): | -1.7400 | |
| Repulse (5,40,3): | 1.4301 | |
| ROCnROLL: | 1 | |
| TRIX (15,9): | -0.0866 | |
| Courbe Coppock: | 5.35 |
| MA7: | 56.8543 | |
| MA20: | 57.5040 | |
| MA50: | 57.8856 | |
| MA100: | 56.8002 | |
| MAexp7: | 57.1667 | |
| MAexp20: | 57.4478 | |
| MAexp50: | 57.4615 | |
| MAexp100: | 55.9631 | |
| Price / MA7: | +1.14% | |
| Price / MA20: | -0.01% | |
| Price / MA50: | -0.67% | |
| Price / MA100: | +1.23% | |
| Price / MAexp7: | +0.58% | |
| Price / MAexp20: | +0.09% | |
| Price / MAexp50: | +0.07% | |
| Price / MAexp100: | +2.75% |
News
The latest news and videos published on HOLCIM N at the time of the analysis were as follows:
- Holcim completes its share buyback program
- Holcim selected to pilot the world’s first science-based targets for nature
- Holcim acquires Besblock Ltd in the UK
- Holcim to deploy 1,000 Volvo electric trucks
- Essential Homes Research Project by Holcim and Norman Foster Foundation unveiled in Venice
About author
Online


Add a comment
Comments
0 comments on the analysis HOLCIM N - Daily