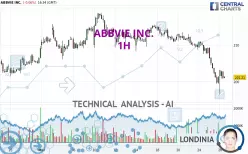
ABBVIE INC. - 1H - Technical analysis published on 03/26/2025 (GMT)
- 105
- 0
Click here for a new analysis!
- Timeframe : 1H
- - Analysis generated on
- Status : LEVEL MAINTAINED

Summary of the analysis

Additional analysis
Quotes
The ABBVIE INC. price is 201.21 USD. The price registered a decrease of -0.07% on the session and was between 196.49 USD and 203.12 USD. This implies that the price is at +2.40% from its lowest and at -0.94% from its highest.A study of price movements over other periods shows the following variations:
Near a new HIGH record (5 years)
Type : Bullish
Timeframe : Weekly
New LOW record (1 month)
Type : Bearish
Timeframe : Weekly
Technical
Technical analysis of ABBVIE INC. in 1H shows a overall strongly bearish trend. 92.86% of the signals given by moving averages are bearish. The overall trend is supported by the strong bearish signals from short-term moving averages. The Central Indicators market scanner currently does not detect any result that concerns moving averages.
An assessment of technical indicators does not currently provide any relevant information to suggest whether the signal given by the technical indicators is more bullish or bearish.
Caution: the Central Indicators scanner currently detects an excess:
MACD indicator: bullish divergence
Type : Bullish
Timeframe : 1 hour
Pivot points : price is under support 3 (Daily)
Type : Neutral
Timeframe : Weekly
Pivot points : price is under support 2 (Weekly)
Type : Neutral
Timeframe : 1 hour
Pivot points : price is under support 2 (Monthly)
Type : Neutral
Timeframe : 1 hour
Central Patterns, the market scanner focusing on chart patterns, resistances and supports found these results:
Near horizontal support
Type : Bullish
Timeframe : 1 hour
Near support of channel
Type : Bullish
Timeframe : 1 hour
No result was found by the Central Candlesticks scanner on Japanese candlesticks.
| S3 | S2 | S1 | Price | R1 | R2 | R3 | |
|---|---|---|---|---|---|---|---|
| ProTrendLines | 189.69 | 195.18 | 198.11 | 201.21 | 201.96 | 206.00 | 211.55 |
| Change (%) | -5.73% | -3.00% | -1.54% | - | +0.37% | +2.38% | +5.14% |
| Change | -11.52 | -6.03 | -3.10 | - | +0.75 | +4.79 | +10.34 |
| Level | Intermediate | Minor | Minor | - | Major | Minor | Intermediate |
Pivot points can also be used to set your price objectives. Here is the price situation in relation to pivot points:
| Pivot points | S3 | S2 | S1 | PP | R1 | R2 | R3 |
|---|---|---|---|---|---|---|---|
| Standard | 187.51 | 193.45 | 197.39 | 203.33 | 207.27 | 213.21 | 217.15 |
| Camarilla | 198.62 | 199.53 | 200.43 | 201.34 | 202.25 | 203.15 | 204.06 |
| Woodie | 186.52 | 192.95 | 196.40 | 202.83 | 206.28 | 212.71 | 216.16 |
| Fibonacci | 193.45 | 197.22 | 199.55 | 203.33 | 207.10 | 209.43 | 213.21 |
| Pivot points | S3 | S2 | S1 | PP | R1 | R2 | R3 |
|---|---|---|---|---|---|---|---|
| Standard | 200.57 | 204.66 | 207.33 | 211.42 | 214.09 | 218.18 | 220.85 |
| Camarilla | 208.15 | 208.77 | 209.39 | 210.01 | 210.63 | 211.25 | 211.87 |
| Woodie | 199.87 | 204.31 | 206.63 | 211.07 | 213.39 | 217.83 | 220.15 |
| Fibonacci | 204.66 | 207.24 | 208.83 | 211.42 | 214.00 | 215.59 | 218.18 |
| Pivot points | S3 | S2 | S1 | PP | R1 | R2 | R3 |
|---|---|---|---|---|---|---|---|
| Standard | 163.47 | 172.81 | 190.92 | 200.26 | 218.37 | 227.71 | 245.82 |
| Camarilla | 201.48 | 204.00 | 206.51 | 209.03 | 211.55 | 214.06 | 216.58 |
| Woodie | 167.86 | 175.00 | 195.31 | 202.45 | 222.76 | 229.90 | 250.21 |
| Fibonacci | 172.81 | 183.30 | 189.77 | 200.26 | 210.75 | 217.22 | 227.71 |
Numerical data
The following is the status of the technical indicators and moving averages at the time of publication of this technical analysis:
| RSI (14): | 34.17 | |
| MACD (12,26,9): | -2.5400 | |
| Directional Movement: | -33.09 | |
| AROON (14): | -85.71 | |
| DEMA (21): | 202.07 | |
| Parabolic SAR (0,02-0,02-0,2): | 203.12 | |
| Elder Ray (13): | -1.32 | |
| Super Trend (3,10): | 205.61 | |
| Zig ZAG (10): | 202.42 | |
| VORTEX (21): | 0.8000 | |
| Stochastique (14,3,5): | 40.62 | |
| TEMA (21): | 200.77 | |
| Williams %R (14): | -54.82 | |
| Chande Momentum Oscillator (20): | -6.51 | |
| Repulse (5,40,3): | 0.6800 | |
| ROCnROLL: | 2 | |
| TRIX (15,9): | -0.1500 | |
| Courbe Coppock: | 7.33 |
| MA7: | 208.71 | |
| MA20: | 210.56 | |
| MA50: | 195.91 | |
| MA100: | 187.01 | |
| MAexp7: | 202.53 | |
| MAexp20: | 205.25 | |
| MAexp50: | 208.35 | |
| MAexp100: | 209.03 | |
| Price / MA7: | -3.59% | |
| Price / MA20: | -4.44% | |
| Price / MA50: | +2.71% | |
| Price / MA100: | +7.59% | |
| Price / MAexp7: | -0.65% | |
| Price / MAexp20: | -1.97% | |
| Price / MAexp50: | -3.43% | |
| Price / MAexp100: | -3.74% |
News
Don't forget to follow the news on ABBVIE INC.. At the time of publication of this analysis, the latest news was as follows:
- AbbVie Showcases Early Pipeline and Scientific Advances in Oncology at AACR Annual Meeting 2025
- AbbVie to Present at the Leerink Partners Global Healthcare Conference
- AbbVie and Gubra Announce License Agreement to Develop an Amylin Analog for the Treatment of Obesity
- AbbVie Receives Positive CHMP Opinion for Upadacitinib (RINVOQ®) for the Treatment of Adults with Giant Cell Arteritis
- AbbVie to Present at the TD Cowen's 45th Annual Health Care Conference
About author
Online


Add a comment
Comments
0 comments on the analysis ABBVIE INC. - 1H