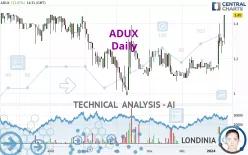
ADUX - Daily - Technical analysis published on 01/15/2024 (GMT)
- 145
- 0
Click here for a new analysis!
- Timeframe : Daily
- - Analysis generated on
- Status : INVALID

Summary of the analysis

Additional analysis
Quotes
The ADUX price is 1.450 EUR. The price registered an increase of +11.97% on the session and was between 1.280 EUR and 1.450 EUR. This implies that the price is at +13.28% from its lowest and at 0% from its highest.The Central Gaps scanner detects the formation of a bullish gap marking the strong presence of buyers against sellers at the opening. This formed a quotation gap.
Opening Gap UP
Type : Bullish
Timeframe : Openning
Here is a more detailed summary of the historical variations registered by ADUX:
New HIGH record (1st january)
Type : Bullish
Timeframe : Weekly
New HIGH record (1 month)
Type : Bullish
Timeframe : Weekly
Abnormal volumes on ADUX were detected by the Central Volumes scanner:
Abnormal volumes
Timeframe : 5 days
Technical
A technical analysis in Daily of this ADUX chart shows a strongly bullish trend. 85.71% of the signals given by moving averages are bullish. The overall trend is supported by the strong bullish signals from short-term moving averages. An assessment of moving averages reveals several bullish signals that could impact this trend:
Moving Average bullish crossovers : AMA20 & AMA50
Type : Bullish
Timeframe : Daily
Moving Average bullish crossovers : AMA50 & AMA100
Type : Bullish
Timeframe : Daily
In fact, according to the parameters integrated into the Central Analyzer system, 17 technical indicators out of 18 analysed are currently bullish. But beware of excesses. The Central Indicators scanner currently detects this:
RSI indicator is overbought : over 80
Type : Neutral
Timeframe : Daily
CCI indicator is overbought : over 100
Type : Neutral
Timeframe : Daily
Williams %R indicator is overbought : over -20
Type : Neutral
Timeframe : Daily
Pivot points : price is over resistance 1
Type : Neutral
Timeframe : Weekly
Pivot points : price is over resistance 3
Type : Neutral
Timeframe : Daily
The Central Patterns scanner, which studies chart patterns, resistances and supports, has identified these signals:
Horizontal resistance is broken
Type : Bullish
Timeframe : Daily
Resistance of channel is broken
Type : Bullish
Timeframe : Daily
Resistance of triangle is broken
Type : Bullish
Timeframe : Daily
The presence of a bullish Japanese candlestick pattern detected by Central Candlesticks that could cause a very short term rebound was also detected:
Long white line
Type : Bullish
Timeframe : Daily
| S3 | S2 | S1 | Price | R1 | R2 | R3 | |
|---|---|---|---|---|---|---|---|
| ProTrendLines | 1.176 | 1.261 | 1.330 | 1.450 | 1.460 | 1.550 | 1.640 |
| Change (%) | -18.90% | -13.03% | -8.28% | - | +0.69% | +6.90% | +13.10% |
| Change | -0.274 | -0.189 | -0.120 | - | +0.010 | +0.100 | +0.190 |
| Level | Intermediate | Major | Minor | - | Major | Minor | Minor |
Pivot points can also be used to set your price objectives. Here is the price situation in relation to pivot points:
| Pivot points | S3 | S2 | S1 | PP | R1 | R2 | R3 |
|---|---|---|---|---|---|---|---|
| Standard | 1.247 | 1.258 | 1.277 | 1.288 | 1.307 | 1.318 | 1.337 |
| Camarilla | 1.287 | 1.290 | 1.292 | 1.295 | 1.298 | 1.301 | 1.303 |
| Woodie | 1.250 | 1.260 | 1.280 | 1.290 | 1.310 | 1.320 | 1.340 |
| Fibonacci | 1.258 | 1.270 | 1.277 | 1.288 | 1.300 | 1.307 | 1.318 |
| Pivot points | S3 | S2 | S1 | PP | R1 | R2 | R3 |
|---|---|---|---|---|---|---|---|
| Standard | 0.888 | 1.012 | 1.153 | 1.277 | 1.418 | 1.542 | 1.683 |
| Camarilla | 1.222 | 1.246 | 1.271 | 1.295 | 1.319 | 1.344 | 1.368 |
| Woodie | 0.898 | 1.016 | 1.163 | 1.281 | 1.428 | 1.546 | 1.693 |
| Fibonacci | 1.012 | 1.113 | 1.175 | 1.277 | 1.378 | 1.440 | 1.542 |
| Pivot points | S3 | S2 | S1 | PP | R1 | R2 | R3 |
|---|---|---|---|---|---|---|---|
| Standard | 0.977 | 1.033 | 1.097 | 1.153 | 1.217 | 1.273 | 1.337 |
| Camarilla | 1.127 | 1.138 | 1.149 | 1.160 | 1.171 | 1.182 | 1.193 |
| Woodie | 0.980 | 1.035 | 1.100 | 1.155 | 1.220 | 1.275 | 1.340 |
| Fibonacci | 1.033 | 1.079 | 1.108 | 1.153 | 1.199 | 1.228 | 1.273 |
Numerical data
The following is the status of technical indicators and moving averages registered at the time this technical analysis was created:
| RSI (14): | 82.11 | |
| MACD (12,26,9): | 0.0470 | |
| Directional Movement: | 36.150 | |
| AROON (14): | 85.714 | |
| DEMA (21): | 1.274 | |
| Parabolic SAR (0,02-0,02-0,2): | 1.155 | |
| Elder Ray (13): | 0.112 | |
| Super Trend (3,10): | 1.172 | |
| Zig ZAG (10): | 1.450 | |
| VORTEX (21): | 1.1310 | |
| Stochastique (14,3,5): | 76.44 | |
| TEMA (21): | 1.318 | |
| Williams %R (14): | 0.00 | |
| Chande Momentum Oscillator (20): | 0.280 | |
| Repulse (5,40,3): | 16.0340 | |
| ROCnROLL: | 1 | |
| TRIX (15,9): | 0.2460 | |
| Courbe Coppock: | 21.94 |
| MA7: | 1.278 | |
| MA20: | 1.199 | |
| MA50: | 1.178 | |
| MA100: | 1.196 | |
| MAexp7: | 1.301 | |
| MAexp20: | 1.224 | |
| MAexp50: | 1.194 | |
| MAexp100: | 1.219 | |
| Price / MA7: | +13.46% | |
| Price / MA20: | +20.93% | |
| Price / MA50: | +23.09% | |
| Price / MA100: | +21.24% | |
| Price / MAexp7: | +11.45% | |
| Price / MAexp20: | +18.46% | |
| Price / MAexp50: | +21.44% | |
| Price / MAexp100: | +18.95% |
News
Don't forget to follow the news on ADUX. At the time of publication of this analysis, the latest news was as follows:
- AdUX : Assemblée Générale Mixte des actionnaires du 21 juin 2022
- AdUX- descriptif de programme de rachat d'actions
- AGM 21 juin 2022 - Mise à disposition des documents préparatoires
- AdUX : Résultats Annuels 2021
- AdUX : Bilan semestriel du contrat de liquidité
About author
Online


Add a comment
Comments
0 comments on the analysis ADUX - Daily