| Open: | 16.74 |
| Change: | +0.04 |
| Volume: | 11,503 |
| Low: | 16.74 |
| High: | 16.93 |
| High / Low range: | 0.19 |
| Type: | Stocks |
| Ticker: | HES |
| ISIN: |
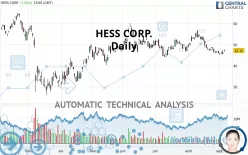
HESS CORP. - Daily - Technical analysis published on 09/05/2020 (GMT)
- 323
- 0
- 09/05/2020 - 16:36
- Who voted?
Click here for a new analysis!
- Timeframe : Daily
- - Analysis generated on 09/05/2020 - 16:36
- Status : TARGET REACHED

Summary of the analysis

Additional analysis
Quotes
HESS CORP. rating 47.15 USD. The price registered an increase of +1.59% on the session and was traded between 46.41 USD and 47.84 USD over the period. The price is currently at +1.59% from its lowest and -1.44% from its highest.The Central Gaps scanner detects a bullish opening. A small advantage for buyers in the very short term.
Bullish opening
Type : Bullish
Timeframe : Openning
So that you have an overall view of the price change, here is a table showing the variations over several periods:
Near a new LOW record (1 month)
Type : Bearish
Timeframe : Weekly
Technical
A technical analysis in Daily of this HESS CORP. chart shows a bearish trend. 75.00% of the signals given by moving averages are bearish. This bearish trend is supported by the strong bearish signals given by short-term moving averages. An assessment of moving averages reveals a bearish signal that could impact this trend:
Moving Average bearish crossovers : MA20 & MA50
Type : Bearish
Timeframe : Daily
An assessment of technical indicators does not currently provide any relevant information on the direction of future price movements.
Caution: the Central Indicators scanner currently detects an excess:
Williams %R indicator is oversold : under -80
Type : Neutral
Timeframe : Daily
Williams %R indicator is overbought : over -20
Type : Neutral
Timeframe : Daily
Price is back under the pivot point
Type : Bearish
Timeframe : Weekly
Central Patterns, the market scanner focusing on chart patterns, resistances and supports found this result:
Near support of triangle
Type : Bullish
Timeframe : Daily
The Central Candlesticks scanner which studies Japanese candlesticks did not detect anything.
| S3 | S2 | S1 | Price | R1 | R2 | R3 | |
|---|---|---|---|---|---|---|---|
| ProTrendLines | 32.54 | 38.34 | 44.68 | 47.15 | 49.43 | 54.45 | 59.94 |
| Change (%) | -30.99% | -18.69% | -5.24% | - | +4.84% | +15.48% | +27.13% |
| Change | -14.61 | -8.81 | -2.47 | - | +2.28 | +7.30 | +12.79 |
| Level | Minor | Major | Major | - | Major | Major | Major |
Pivot points can also be used to set your price objectives. Here is the price situation in relation to pivot points:
| Pivot points | S3 | S2 | S1 | PP | R1 | R2 | R3 |
|---|---|---|---|---|---|---|---|
| Standard | 43.31 | 44.36 | 45.38 | 46.43 | 47.45 | 48.50 | 49.52 |
| Camarilla | 45.84 | 46.03 | 46.22 | 46.41 | 46.60 | 46.79 | 46.98 |
| Woodie | 43.31 | 44.35 | 45.38 | 46.42 | 47.45 | 48.49 | 49.52 |
| Fibonacci | 44.36 | 45.15 | 45.64 | 46.43 | 47.22 | 47.71 | 48.50 |
| Pivot points | S3 | S2 | S1 | PP | R1 | R2 | R3 |
|---|---|---|---|---|---|---|---|
| Standard | 42.55 | 44.17 | 45.55 | 47.17 | 48.55 | 50.17 | 51.55 |
| Camarilla | 46.12 | 46.39 | 46.67 | 46.94 | 47.22 | 47.49 | 47.77 |
| Woodie | 42.44 | 44.11 | 45.44 | 47.11 | 48.44 | 50.11 | 51.44 |
| Fibonacci | 44.17 | 45.31 | 46.02 | 47.17 | 48.31 | 49.02 | 50.17 |
| Pivot points | S3 | S2 | S1 | PP | R1 | R2 | R3 |
|---|---|---|---|---|---|---|---|
| Standard | 31.02 | 38.35 | 42.20 | 49.53 | 53.37 | 60.70 | 64.55 |
| Camarilla | 42.97 | 43.99 | 45.02 | 46.04 | 47.06 | 48.09 | 49.11 |
| Woodie | 29.28 | 37.48 | 40.45 | 48.66 | 51.63 | 59.83 | 62.80 |
| Fibonacci | 38.35 | 42.62 | 45.26 | 49.53 | 53.80 | 56.43 | 60.70 |
Numerical data
The following are the details of the technical indicators and moving averages that were collected to generate this technical analysis:
| RSI (14): | 44.02 | |
| MACD (12,26,9): | -1.1800 | |
| Directional Movement: | -2.57 | |
| AROON (14): | -78.57 | |
| DEMA (21): | 46.77 | |
| Parabolic SAR (0,02-0,02-0,2): | 48.39 | |
| Elder Ray (13): | -0.32 | |
| Super Trend (3,10): | 50.56 | |
| Zig ZAG (10): | 47.15 | |
| VORTEX (21): | 0.8100 | |
| Stochastique (14,3,5): | 17.37 | |
| TEMA (21): | 45.72 | |
| Williams %R (14): | -72.55 | |
| Chande Momentum Oscillator (20): | -1.34 | |
| Repulse (5,40,3): | 0.6700 | |
| ROCnROLL: | 2 | |
| TRIX (15,9): | -0.2600 | |
| Courbe Coppock: | 21.60 |
| MA7: | 46.40 | |
| MA20: | 49.14 | |
| MA50: | 49.38 | |
| MA100: | 48.29 | |
| MAexp7: | 46.74 | |
| MAexp20: | 48.13 | |
| MAexp50: | 48.94 | |
| MAexp100: | 49.18 | |
| Price / MA7: | +1.62% | |
| Price / MA20: | -4.05% | |
| Price / MA50: | -4.52% | |
| Price / MA100: | -2.36% | |
| Price / MAexp7: | +0.88% | |
| Price / MAexp20: | -2.04% | |
| Price / MAexp50: | -3.66% | |
| Price / MAexp100: | -4.13% |
News
The latest news and videos published on HESS CORP. at the time of the analysis were as follows:
- 11/07/2018 - 13:55 Research Report Identifies Allete, Ares Capital, Pembina Pipeline, Veeco Instruments, Hess, and Newell Brands with Renewed Outlook — Fundamental Analysis, Calculating Forward Movement
- 11/06/2018 - 12:50 Analysis: Positioning to Benefit within Hess Midstream Partners LP, Quanta Services, ServiceSource International, Meritor, Donegal Group, and GenMark Diagnostics — Research Highlights Growth, Revenue, and Consolidated Results
- 09/05/2018 - 12:25 New Research Coverage Highlights SP Plus, Hess Midstream Partners LP, Digital Turbine, Farmer Brothers, Children's Place, and Key Energy Services — Consolidated Revenues, Company Growth, and Expectations for 2018
- 08/15/2018 - 12:20 New Research: Key Drivers of Growth for Sigma Designs, The Bancorp, Inc., Primoris Services, PetMed Express, Hess Midstream Partners LP, and Park Electrochemical — Factors of Influence, Major Initiatives and Sustained Production
- 06/12/2018 - 11:45 New Research: Key Drivers of Growth for CNA Financial, AutoNation, Hess, Infinity Pharmaceuticals, Regulus Therapeutics, and Weyerhaeuser — Factors of Influence, Major Initiatives and Sustained Production
About author

Online


Add a comment
Comments
0 comments on the analysis HESS CORP. - Daily