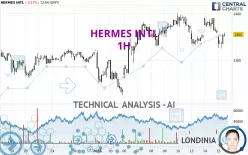
HERMES INTL - 1H - Technical analysis published on 01/15/2025 (GMT)
- 76
- 0
- Timeframe : 1H
- - Analysis generated on
- Status : NEUTRAL

Summary of the analysis

Additional analysis
Quotes
HERMES INTL rating 2,355.0 EUR. On the day, this instrument lost -0.17% with the lowest point at 2,325.0 EUR and the highest point at 2,359.0 EUR. The deviation from the price is +1.29% for the low point and -0.17% for the high point.The Central Gaps scanner detects the formation of a bearish gap marking the strong presence of sellers ahead of buyers at the opening. This formed a quotation gap.
Opening Gap DOWN
Type : Bearish
Timeframe : Openning
So that you have an overall view of the price change, here is a table showing the variations over several periods:
Near a new HIGH record (5 years)
Type : Bullish
Timeframe : Weekly
Near a new HIGH record (1 year)
Type : Bullish
Timeframe : Weekly
Near a new LOW record (1st january)
Type : Bearish
Timeframe : Weekly
Near a new LOW record (1 month)
Type : Bearish
Timeframe : Weekly
Technical
A technical analysis in 1H of this HERMES INTL chart shows a slightly bullish trend. 57.14% of the signals given by moving averages are bullish. Caution: the slightly bearish signals currently given by short-term moving averages indicate that the overall trend could be reversed. The Central Indicators scanner detects bullish and bearish signals on moving averages that could impact this trend:
Bullish trend reversal : Moving Average 20
Type : Bullish
Timeframe : 1 hour
Bullish trend reversal : adaptative moving average 100
Type : Bullish
Timeframe : 1 hour
Bullish price crossover with Moving Average 20
Type : Bullish
Timeframe : 1 hour
Bearish price crossover with adaptative moving average 20
Type : Bearish
Timeframe : 1 hour
An assessment of technical indicators does not currently provide any relevant information on the direction of future price movements.
Central Indicators, the scanner specialised in technical indicators, has identified these signals:
RSI indicator is back over 50
Type : Bullish
Timeframe : 1 hour
Williams %R indicator is back over -50
Type : Bullish
Timeframe : 1 hour
The Central Patterns scanner, which studies chart patterns, resistances and supports, has identified this signal:
Near support of channel
Type : Bullish
Timeframe : 1 hour
The Central Candlesticks scanner, specialised in Japanese candlesticks, did not identify any signals.
| S3 | S2 | S1 | Price | R1 | R2 | |
|---|---|---|---|---|---|---|
| ProTrendLines | 2,262.0 | 2,300.7 | 2,333.0 | 2,355.0 | 2,371.0 | 2,388.0 |
| Change (%) | -3.95% | -2.31% | -0.93% | - | +0.68% | +1.40% |
| Change | -93.0 | -54.3 | -22.0 | - | +16.0 | +33.0 |
| Level | Minor | Minor | Intermediate | - | Minor | Major |
Pivot points can also be used to set your price objectives. Here is the price situation in relation to pivot points:
| Pivot points | S3 | S2 | S1 | PP | R1 | R2 | R3 |
|---|---|---|---|---|---|---|---|
| Standard | 2,314.7 | 2,336.3 | 2,347.7 | 2,369.3 | 2,380.7 | 2,402.3 | 2,413.7 |
| Camarilla | 2,349.9 | 2,353.0 | 2,356.0 | 2,359.0 | 2,362.0 | 2,365.1 | 2,368.1 |
| Woodie | 2,309.5 | 2,333.8 | 2,342.5 | 2,366.8 | 2,375.5 | 2,399.8 | 2,408.5 |
| Fibonacci | 2,336.3 | 2,348.9 | 2,356.7 | 2,369.3 | 2,381.9 | 2,389.7 | 2,402.3 |
| Pivot points | S3 | S2 | S1 | PP | R1 | R2 | R3 |
|---|---|---|---|---|---|---|---|
| Standard | 2,143.3 | 2,201.7 | 2,284.3 | 2,342.7 | 2,425.3 | 2,483.7 | 2,566.3 |
| Camarilla | 2,328.2 | 2,341.2 | 2,354.1 | 2,367.0 | 2,379.9 | 2,392.9 | 2,405.8 |
| Woodie | 2,155.5 | 2,207.8 | 2,296.5 | 2,348.8 | 2,437.5 | 2,489.8 | 2,578.5 |
| Fibonacci | 2,201.7 | 2,255.5 | 2,288.8 | 2,342.7 | 2,396.5 | 2,429.8 | 2,483.7 |
| Pivot points | S3 | S2 | S1 | PP | R1 | R2 | R3 |
|---|---|---|---|---|---|---|---|
| Standard | 1,889.0 | 1,976.0 | 2,149.0 | 2,236.0 | 2,409.0 | 2,496.0 | 2,669.0 |
| Camarilla | 2,250.5 | 2,274.3 | 2,298.2 | 2,322.0 | 2,345.8 | 2,369.7 | 2,393.5 |
| Woodie | 1,932.0 | 1,997.5 | 2,192.0 | 2,257.5 | 2,452.0 | 2,517.5 | 2,712.0 |
| Fibonacci | 1,976.0 | 2,075.3 | 2,136.7 | 2,236.0 | 2,335.3 | 2,396.7 | 2,496.0 |
Numerical data
The following are the details of the technical indicators and moving averages that were collected to generate this technical analysis:
| RSI (14): | 48.80 | |
| MACD (12,26,9): | -3.8000 | |
| Directional Movement: | -4.1 | |
| AROON (14): | -78.6 | |
| DEMA (21): | 2,353.8 | |
| Parabolic SAR (0,02-0,02-0,2): | 2,383.5 | |
| Elder Ray (13): | -0.2 | |
| Super Trend (3,10): | 2,377.1 | |
| Zig ZAG (10): | 2,356.0 | |
| VORTEX (21): | 1.0000 | |
| Stochastique (14,3,5): | 34.30 | |
| TEMA (21): | 2,347.7 | |
| Williams %R (14): | -54.50 | |
| Chande Momentum Oscillator (20): | -24.0 | |
| Repulse (5,40,3): | 0.5000 | |
| ROCnROLL: | -1 | |
| TRIX (15,9): | 0.0000 | |
| Courbe Coppock: | 0.40 |
| MA7: | 2,363.7 | |
| MA20: | 2,322.3 | |
| MA50: | 2,192.7 | |
| MA100: | 2,130.6 | |
| MAexp7: | 2,351.2 | |
| MAexp20: | 2,357.7 | |
| MAexp50: | 2,355.1 | |
| MAexp100: | 2,339.4 | |
| Price / MA7: | -0.37% | |
| Price / MA20: | +1.41% | |
| Price / MA50: | +7.40% | |
| Price / MA100: | +10.53% | |
| Price / MAexp7: | +0.16% | |
| Price / MAexp20: | -0.11% | |
| Price / MAexp50: | +0.00% | |
| Price / MAexp100: | +0.67% |
News
The last news published on HERMES INTL at the time of the generation of this analysis was as follows:
- Federated Hermes Premier Municipal Income Fund declares dividend
- Federated Hermes, Inc. announces fourth quarter and year-end 2024 earnings and conference call dates
- Month-end portfolio data now available for Federated Hermes Premier Municipal Income Fund
- Hermès International : Shares and voting rights as of 30th November 2024
- Federated Hermes Premier Municipal Income Fund declares dividend and announces new Trustees
About author
Online


Add a comment
Comments
0 comments on the analysis HERMES INTL - 1H