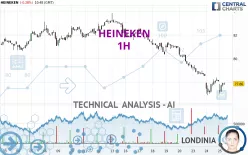
HEINEKEN - 1H - Technical analysis published on 09/25/2024 (GMT)
- 125
- 0
Click here for a new analysis!
- Timeframe : 1H
- - Analysis generated on
- Status : INVALID

Summary of the analysis

Additional analysis
Quotes
HEINEKEN rating 77.86 EUR. On the day, this instrument lost -0.28% and was between 77.02 EUR and 77.98 EUR. This implies that the price is at +1.09% from its lowest and at -0.15% from its highest.Here is a more detailed summary of the historical variations registered by HEINEKEN:
Near a new LOW record (1 year)
Type : Bearish
Timeframe : Weekly
Near a new LOW record (1st january)
Type : Bearish
Timeframe : Weekly
Near a new LOW record (1 month)
Type : Bearish
Timeframe : Weekly
Technical
Technical analysis of HEINEKEN in 1H shows a overall strongly bearish trend. 92.86% of the signals given by moving averages are bearish. The overall trend is supported by the strong bearish signals from short-term moving averages. There is no crossing of moving average by the price or crossing of moving averages between themselves.
An assessment of technical indicators does not currently provide any relevant information on the direction of future price movements.
Central Indicators, the detector scanner for these technical indicators has recently detected several signals:
Pivot points : price is under support 1
Type : Neutral
Timeframe : Weekly
Momentum indicator is back over 0
Type : Bullish
Timeframe : 1 hour
The Central Patterns scanner, which studies chart patterns, resistances and supports, has identified this signal:
Near resistance of channel
Type : Bearish
Timeframe : 1 hour
For a small setback in the very short term, the Central Candlesticks scanner currently notes the presence of this bearish pattern in Japanese candlesticks:
Bearish harami
Type : Bearish
Timeframe : 1 hour
| S3 | S2 | S1 | Price | R1 | R2 | R3 | |
|---|---|---|---|---|---|---|---|
| ProTrendLines | 49.65 | 74.38 | 76.90 | 77.86 | 79.24 | 80.65 | 81.77 |
| Change (%) | -36.23% | -4.47% | -1.23% | - | +1.77% | +3.58% | +5.02% |
| Change | -28.21 | -3.48 | -0.96 | - | +1.38 | +2.79 | +3.91 |
| Level | Minor | Major | Intermediate | - | Minor | Intermediate | Minor |
To determine price objectives, it is also possible to use the pivot points. Here is the price position in relation to pivot points:
| Pivot points | S3 | S2 | S1 | PP | R1 | R2 | R3 |
|---|---|---|---|---|---|---|---|
| Standard | 75.69 | 76.29 | 77.19 | 77.79 | 78.69 | 79.29 | 80.19 |
| Camarilla | 77.67 | 77.81 | 77.94 | 78.08 | 78.22 | 78.36 | 78.49 |
| Woodie | 75.83 | 76.37 | 77.33 | 77.87 | 78.83 | 79.37 | 80.33 |
| Fibonacci | 76.29 | 76.87 | 77.22 | 77.79 | 78.37 | 78.72 | 79.29 |
| Pivot points | S3 | S2 | S1 | PP | R1 | R2 | R3 |
|---|---|---|---|---|---|---|---|
| Standard | 74.64 | 76.90 | 78.08 | 80.34 | 81.52 | 83.78 | 84.96 |
| Camarilla | 78.31 | 78.63 | 78.95 | 79.26 | 79.58 | 79.89 | 80.21 |
| Woodie | 74.10 | 76.63 | 77.54 | 80.07 | 80.98 | 83.51 | 84.42 |
| Fibonacci | 76.90 | 78.21 | 79.03 | 80.34 | 81.65 | 82.47 | 83.78 |
| Pivot points | S3 | S2 | S1 | PP | R1 | R2 | R3 |
|---|---|---|---|---|---|---|---|
| Standard | 75.09 | 76.95 | 79.21 | 81.07 | 83.33 | 85.19 | 87.45 |
| Camarilla | 80.33 | 80.71 | 81.08 | 81.46 | 81.84 | 82.22 | 82.59 |
| Woodie | 75.28 | 77.05 | 79.40 | 81.17 | 83.52 | 85.29 | 87.64 |
| Fibonacci | 76.95 | 78.53 | 79.50 | 81.07 | 82.65 | 83.62 | 85.19 |
Numerical data
The following are the details of the technical indicators and moving averages that were collected to generate this technical analysis:
| RSI (14): | 39.68 | |
| MACD (12,26,9): | -0.5300 | |
| Directional Movement: | -19.06 | |
| AROON (14): | -21.43 | |
| DEMA (21): | 77.47 | |
| Parabolic SAR (0,02-0,02-0,2): | 78.32 | |
| Elder Ray (13): | -0.11 | |
| Super Trend (3,10): | 78.48 | |
| Zig ZAG (10): | 77.86 | |
| VORTEX (21): | 0.9500 | |
| Stochastique (14,3,5): | 49.32 | |
| TEMA (21): | 77.53 | |
| Williams %R (14): | -47.25 | |
| Chande Momentum Oscillator (20): | 0.42 | |
| Repulse (5,40,3): | 0.4800 | |
| ROCnROLL: | 2 | |
| TRIX (15,9): | -0.1200 | |
| Courbe Coppock: | 1.73 |
| MA7: | 79.52 | |
| MA20: | 81.08 | |
| MA50: | 81.88 | |
| MA100: | 86.88 | |
| MAexp7: | 77.84 | |
| MAexp20: | 78.23 | |
| MAexp50: | 79.31 | |
| MAexp100: | 80.22 | |
| Price / MA7: | -2.09% | |
| Price / MA20: | -3.97% | |
| Price / MA50: | -4.91% | |
| Price / MA100: | -10.38% | |
| Price / MAexp7: | +0.03% | |
| Price / MAexp20: | -0.47% | |
| Price / MAexp50: | -1.83% | |
| Price / MAexp100: | -2.94% |
News
The latest news and videos published on HEINEKEN at the time of the analysis were as follows:
-
 Dividend Watch: Can Heineken Keep The Bubbles Flowing?
- Heineken N.V. reports 2024 half year results
- Heineken N.V. reports on 2024 first-quarter trading
- BELLAGIO FOUNTAIN CLUB RETURNS FOR FORMULA 1 HEINEKEN SILVER LAS VEGAS GRAND PRIX 2024 NOVEMBER 21-23
- Heineken N.V. reports 2023 full year results
About author
Online


Add a comment
Comments
0 comments on the analysis HEINEKEN - 1H