| Open: | 65.72 |
| Change: | +0.02 |
| Volume: | 113,806 |
| Low: | 65.66 |
| High: | 66.22 |
| High / Low range: | 0.56 |
| Type: | Stocks |
| Ticker: | HEIA |
| ISIN: | NL0000009165 |
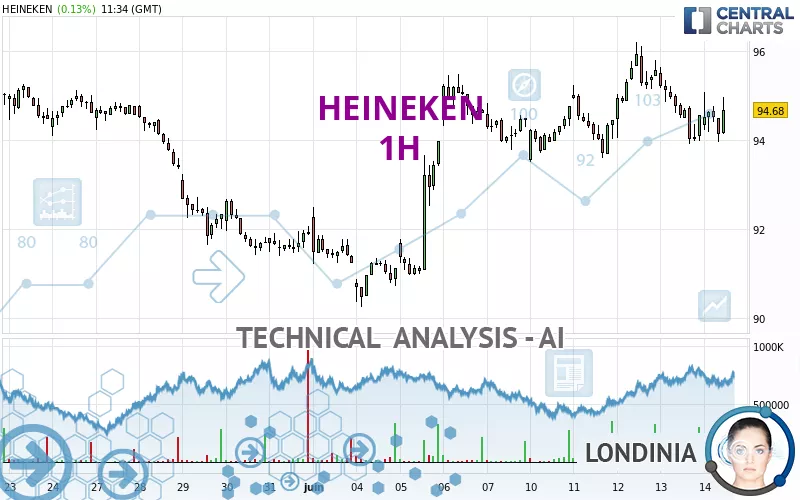
HEINEKEN - 1H - Technical analysis published on 06/14/2024 (GMT)
- 132
- 0
- 06/14/2024 - 11:50
Click here for a new analysis!
- Timeframe : 1H
- - Analysis generated on 06/14/2024 - 11:50
- Status : INVALID
Summary of the analysis

Additional analysis
Quotes
The HEINEKEN rating is 94.78 EUR. The price has increased by +0.23% since the last closing and was traded between 93.94 EUR and 95.08 EUR over the period. The price is currently at +0.89% from its lowest and -0.32% from its highest.The Central Gaps scanner detects a bearish opening marking the presence of sellers ahead of buyers at the opening but not sufficiently marked to allow the price to register a quotation gap.
Bearish opening
Type : Bearish
Timeframe : Openning
A study of price movements over other periods shows the following variations:
Near a new HIGH record (1 year)
Type : Bullish
Timeframe : Weekly
Near a new HIGH record (1st january)
Type : Bullish
Timeframe : Weekly
Near a new LOW record (1 month)
Type : Bearish
Timeframe : Weekly
Technical
A technical analysis in 1H of this HEINEKEN chart shows a bullish trend. 64.29% of the signals given by moving averages are bullish. Caution: the neutral signals currently given by the short-term moving averages indicate that this bullish trend is showing signs of running out of steam. An assessment of moving averages reveals a bearish signal that could impact this trend:
Bearish trend reversal : adaptative moving average 50
Type : Bearish
Timeframe : 1 hour
In fact, of the 18 technical indicators analysed by Central Analyzer, 6 are bullish, 5 are neutral and 7 are bearish. Caution: the Central Indicators scanner currently detects an excess:
CCI indicator: bullish divergence
Type : Bullish
Timeframe : 1 hour
Williams %R indicator is oversold : under -80
Type : Neutral
Timeframe : 1 hour
Central Patterns, the market scanner focusing on chart patterns, resistances and supports found these results:
Near support of channel
Type : Bullish
Timeframe : 1 hour
Near support of triangle
Type : Bullish
Timeframe : 1 hour
For a small rebound in the very short term, the Central Candlesticks scanner currently notes the presence of these bullish patterns in Japanese candlesticks:
Bullish harami
Type : Bullish
Timeframe : 1 hour
Bullish harami cross
Type : Bullish
Timeframe : 1 hour
| S3 | S2 | S1 | Price | R1 | R2 | R3 | |
|---|---|---|---|---|---|---|---|
| ProTrendLines | 92.48 | 93.58 | 94.37 | 94.78 | 95.48 | 96.70 | 97.50 |
| Change (%) | -2.43% | -1.27% | -0.43% | - | +0.74% | +2.03% | +2.87% |
| Change | -2.30 | -1.20 | -0.41 | - | +0.70 | +1.92 | +2.72 |
| Level | Minor | Intermediate | Major | - | Intermediate | Major | Intermediate |
To determine price objectives, it is also possible to use the pivot points. Here is the price position in relation to pivot points:
| Pivot points | S3 | S2 | S1 | PP | R1 | R2 | R3 |
|---|---|---|---|---|---|---|---|
| Standard | 92.02 | 92.96 | 93.76 | 94.70 | 95.50 | 96.44 | 97.24 |
| Camarilla | 94.08 | 94.24 | 94.40 | 94.56 | 94.72 | 94.88 | 95.04 |
| Woodie | 91.95 | 92.93 | 93.69 | 94.67 | 95.43 | 96.41 | 97.17 |
| Fibonacci | 92.96 | 93.63 | 94.04 | 94.70 | 95.37 | 95.78 | 96.44 |
| Pivot points | S3 | S2 | S1 | PP | R1 | R2 | R3 |
|---|---|---|---|---|---|---|---|
| Standard | 86.09 | 88.17 | 91.33 | 93.41 | 96.57 | 98.65 | 101.81 |
| Camarilla | 93.06 | 93.54 | 94.02 | 94.50 | 94.98 | 95.46 | 95.94 |
| Woodie | 86.64 | 88.44 | 91.88 | 93.68 | 97.12 | 98.92 | 102.36 |
| Fibonacci | 88.17 | 90.17 | 91.41 | 93.41 | 95.41 | 96.65 | 98.65 |
| Pivot points | S3 | S2 | S1 | PP | R1 | R2 | R3 |
|---|---|---|---|---|---|---|---|
| Standard | 80.49 | 85.01 | 88.45 | 92.97 | 96.41 | 100.93 | 104.37 |
| Camarilla | 89.69 | 90.42 | 91.15 | 91.88 | 92.61 | 93.34 | 94.07 |
| Woodie | 79.94 | 84.74 | 87.90 | 92.70 | 95.86 | 100.66 | 103.82 |
| Fibonacci | 85.01 | 88.05 | 89.93 | 92.97 | 96.01 | 97.89 | 100.93 |
Numerical data
The following is the status of technical indicators and moving averages registered at the time this technical analysis was created:
| RSI (14): | 43.77 | |
| MACD (12,26,9): | -0.0900 | |
| Directional Movement: | -4.38 | |
| AROON (14): | -50.00 | |
| DEMA (21): | 94.54 | |
| Parabolic SAR (0,02-0,02-0,2): | 95.28 | |
| Elder Ray (13): | -0.33 | |
| Super Trend (3,10): | 95.55 | |
| Zig ZAG (10): | 94.30 | |
| VORTEX (21): | 0.9200 | |
| Stochastique (14,3,5): | 23.90 | |
| TEMA (21): | 94.30 | |
| Williams %R (14): | -73.56 | |
| Chande Momentum Oscillator (20): | -0.76 | |
| Repulse (5,40,3): | 0.1100 | |
| ROCnROLL: | -1 | |
| TRIX (15,9): | 0.0000 | |
| Courbe Coppock: | 2.01 |
| MA7: | 94.72 | |
| MA20: | 94.00 | |
| MA50: | 91.72 | |
| MA100: | 89.81 | |
| MAexp7: | 94.47 | |
| MAexp20: | 94.59 | |
| MAexp50: | 94.39 | |
| MAexp100: | 94.01 | |
| Price / MA7: | +0.06% | |
| Price / MA20: | +0.83% | |
| Price / MA50: | +3.34% | |
| Price / MA100: | +5.53% | |
| Price / MAexp7: | +0.33% | |
| Price / MAexp20: | +0.20% | |
| Price / MAexp50: | +0.41% | |
| Price / MAexp100: | +0.82% |
News
Don't forget to follow the news on HEINEKEN. At the time of publication of this analysis, the latest news was as follows:
- 04/24/2024 - 06:00 Heineken N.V. reports on 2024 first-quarter trading
- 03/25/2024 - 17:15 BELLAGIO FOUNTAIN CLUB RETURNS FOR FORMULA 1 HEINEKEN SILVER LAS VEGAS GRAND PRIX 2024 NOVEMBER 21-23
- 02/14/2024 - 06:00 Heineken N.V. reports 2023 full year results
- 11/15/2023 - 18:45 Sphere And Formula 1 Heineken Silver Las Vegas Grand Prix Announce Custom Race Content For Exosphere
- 10/26/2023 - 17:35 MGM RESORTS REVEALS NEW DETAILS ABOUT BELLAGIO FOUNTAIN CLUB EXPERIENCE AT FORMULA 1® HEINEKEN SILVER LAS VEGAS GRAND PRIX
About author
Online


Add a comment
Comments
0 comments on the analysis HEINEKEN - 1H