| Open: | 4,187.12 |
| Change: | -75.70 |
| Volume: | 0 |
| Low: | 4,099.54 |
| High: | 4,198.92 |
| High / Low range: | 99.38 |
| Type: | Stocks |
| Ticker: | HEI |
| ISIN: | DE0006047004 |
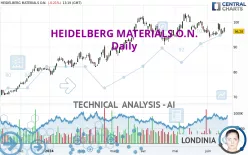
HEIDELBERG MATERIALS O.N. - Daily - Technical analysis published on 06/18/2024 (GMT)
- 132
- 0
- 06/18/2024 - 13:35
Click here for a new analysis!
- Timeframe : Daily
- - Analysis generated on 06/18/2024 - 13:35
- Status : TARGET REACHED

Summary of the analysis

Additional analysis
Quotes
The HEIDELBERG MATERIALS O.N. price is 96.28 EUR. On the day, this instrument lost -0.21% and was between 95.88 EUR and 97.84 EUR. This implies that the price is at +0.42% from its lowest and at -1.59% from its highest.The Central Gaps scanner detects a bullish gap which is a sign that buyers have taken the lead in the very short term.
Opening Gap UP
Type : Bullish
Timeframe : Openning
So that you have an overall view of the price change, here is a table showing the variations over several periods:
Near a new HIGH record (5 years)
Type : Bullish
Timeframe : Weekly
Near a new HIGH record (1 year)
Type : Bullish
Timeframe : Weekly
Near a new HIGH record (1st january)
Type : Bullish
Timeframe : Weekly
Near a new HIGH record (1 month)
Type : Bullish
Timeframe : Weekly
Technical
A technical analysis in Daily of this HEIDELBERG MATERIALS O.N. chart shows a bullish trend. The signals given by moving averages are 64.29% bullish. This bullish trend could slow down given the neutral signals currently being given by short-term moving averages. An assessment of moving averages reveals a bearish signal that could impact this trend:
Bearish price crossover with adaptative moving average 20
Type : Bearish
Timeframe : Daily
The technical indicators are generally neutral. They do not provide relevant information on the direction of future price movements.
Central Indicators, the scanner specialised in technical indicators, has identified these signals:
RSI indicator is back under 50
Type : Bearish
Timeframe : Daily
Aroon indicator bullish trend
Type : Bullish
Timeframe : Daily
Momentum indicator is back over 0
Type : Bullish
Timeframe : Daily
Central Patterns, the scanner specializing in chart patterns, did not identify any signals.
The Central Candlesticks scanner which studies Japanese candlesticks did not detect anything.
| S3 | S2 | S1 | Price | R1 | |
|---|---|---|---|---|---|
| ProTrendLines | 69.59 | 79.22 | 89.55 | 96.28 | 98.89 |
| Change (%) | -27.72% | -17.72% | -6.99% | - | +2.71% |
| Change | -26.69 | -17.06 | -6.73 | - | +2.61 |
| Level | Major | Major | Intermediate | - | Major |
Pivot points can also be used to set your price objectives. Here is the price situation in relation to pivot points:
| Pivot points | S3 | S2 | S1 | PP | R1 | R2 | R3 |
|---|---|---|---|---|---|---|---|
| Standard | 94.43 | 94.87 | 95.67 | 96.11 | 96.91 | 97.35 | 98.15 |
| Camarilla | 96.14 | 96.25 | 96.37 | 96.48 | 96.59 | 96.71 | 96.82 |
| Woodie | 94.62 | 94.96 | 95.86 | 96.20 | 97.10 | 97.44 | 98.34 |
| Fibonacci | 94.87 | 95.34 | 95.63 | 96.11 | 96.58 | 96.87 | 97.35 |
| Pivot points | S3 | S2 | S1 | PP | R1 | R2 | R3 |
|---|---|---|---|---|---|---|---|
| Standard | 88.67 | 91.67 | 93.47 | 96.47 | 98.27 | 101.27 | 103.07 |
| Camarilla | 93.94 | 94.38 | 94.82 | 95.26 | 95.70 | 96.14 | 96.58 |
| Woodie | 88.06 | 91.37 | 92.86 | 96.17 | 97.66 | 100.97 | 102.46 |
| Fibonacci | 91.67 | 93.51 | 94.64 | 96.47 | 98.31 | 99.44 | 101.27 |
| Pivot points | S3 | S2 | S1 | PP | R1 | R2 | R3 |
|---|---|---|---|---|---|---|---|
| Standard | 81.68 | 86.40 | 91.06 | 95.78 | 100.44 | 105.16 | 109.82 |
| Camarilla | 93.14 | 94.00 | 94.86 | 95.72 | 96.58 | 97.44 | 98.30 |
| Woodie | 81.65 | 86.39 | 91.03 | 95.77 | 100.41 | 105.15 | 109.79 |
| Fibonacci | 86.40 | 89.98 | 92.20 | 95.78 | 99.36 | 101.58 | 105.16 |
Numerical data
The following is the status of the technical indicators and moving averages at the time of publication of this technical analysis:
| RSI (14): | 49.69 | |
| MACD (12,26,9): | 0.0800 | |
| Directional Movement: | 8.17 | |
| AROON (14): | 42.86 | |
| DEMA (21): | 96.60 | |
| Parabolic SAR (0,02-0,02-0,2): | 94.15 | |
| Elder Ray (13): | 0.51 | |
| Super Trend (3,10): | 100.40 | |
| Zig ZAG (10): | 96.12 | |
| VORTEX (21): | 0.9000 | |
| Stochastique (14,3,5): | 37.81 | |
| TEMA (21): | 95.97 | |
| Williams %R (14): | -58.13 | |
| Chande Momentum Oscillator (20): | 0.40 | |
| Repulse (5,40,3): | -2.5300 | |
| ROCnROLL: | -1 | |
| TRIX (15,9): | 0.0300 | |
| Courbe Coppock: | 3.28 |
| MA7: | 96.43 | |
| MA20: | 96.77 | |
| MA50: | 95.33 | |
| MA100: | 91.44 | |
| MAexp7: | 96.27 | |
| MAexp20: | 96.37 | |
| MAexp50: | 95.07 | |
| MAexp100: | 91.37 | |
| Price / MA7: | -0.16% | |
| Price / MA20: | -0.51% | |
| Price / MA50: | +1.00% | |
| Price / MA100: | +5.29% | |
| Price / MAexp7: | +0.01% | |
| Price / MAexp20: | -0.09% | |
| Price / MAexp50: | +1.27% | |
| Price / MAexp100: | +5.37% |
News
The latest news and videos published on HEIDELBERG MATERIALS O.N. at the time of the analysis were as follows:
- 06/13/2024 - 07:45 Commerzbank AG (London Branch) - Pre-Stabilisation Notice Heidelberg Materials AG EUR 10yr
- 04/12/2024 - 05:39 Heidelberg Materials North America Announces Latest Milestone in Edmonton CCUS Project
- 04/04/2024 - 15:17 EQS-AGM: Heidelberg Materials AG: Announcement of the Convening of the General Meeting in Heidelberg on 16.05.2024 according to article 121 AktG (German Stock Companies Act) with the objective of Europe-wide distribution
- 02/21/2024 - 19:01 EQS-Adhoc: Ad-hoc: Heidelberg Materials decides on share buyback programme with a total amount of up to €1.2 billion
- 10/19/2023 - 11:17 EQS-Adhoc: Heidelberg Materials publishes preliminary results of the third quarter 2023: operating result above market expectations – full year outlook raised
About author
Online


Add a comment
Comments
0 comments on the analysis HEIDELBERG MATERIALS O.N. - Daily