HCP INC. - Daily - Technical analysis published on 10/28/2019 (GMT)
- 136
- 0
- Who voted?
- Timeframe : Daily
- - Analysis generated on
- Status : CANCELLED

Summary of the analysis
Additional analysis
Quotes
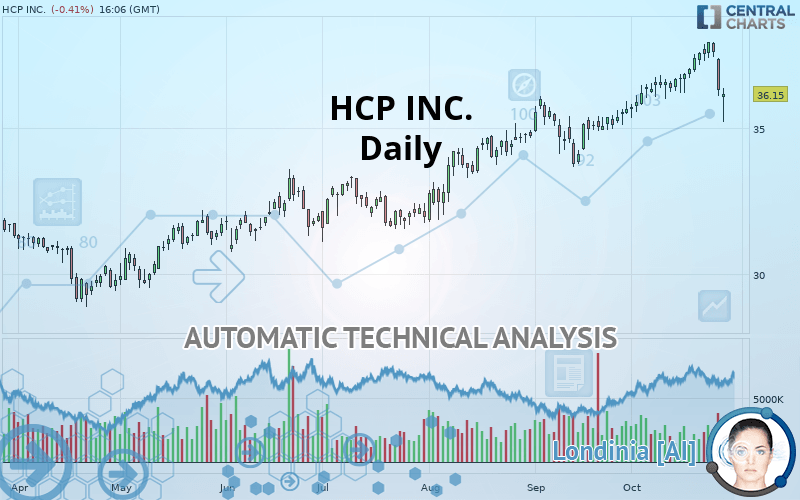
The HCP INC. price is 36.16 USD. The price registered a decrease of -0.39% on the session and was between 35.19 USD and 36.37 USD. This implies that the price is at +2.76% from its lowest and at -0.58% from its highest.The Central Gaps scanner detects the formation of a bearish gap marking the strong presence of sellers ahead of buyers at the opening. This formed a quotation gap.
Opening Gap DOWN
Type : Bearish
Timeframe : Openning
A study of price movements over other periods shows the following variations:
Near a new HIGH record (1 year)
Type : Bullish
Timeframe : Weekly
Near a new HIGH record (1st january)
Type : Bullish
Timeframe : Weekly
Technical
Technical analysis of this Daily chart of HCP INC. indicates that the overall trend is bullish. 75% of the signals given by moving averages are bullish. Caution: the neutral signals currently given by short-term moving averages show us that the global trend is losing momentum. An assessment of moving averages reveals several bearish signals that could impact this trend:
Bearish trend reversal : adaptative moving average 20
Type : Bearish
Timeframe : Daily
Bearish price crossover with Moving Average 20
Type : Bearish
Timeframe : Daily
Bearish price crossover with adaptative moving average 20
Type : Bearish
Timeframe : Daily
In fact, Central Analyzer took into account 18 technical indicators and the result was as follows: 3 are bullish, 9 are neutral and 6 are bearish. But beware of excesses. The Central Indicators scanner currently detects this:
Williams %R indicator is oversold : under -80
Type : Neutral
Timeframe : Daily
RSI indicator is back under 50
Type : Bearish
Timeframe : Daily
MACD crosses DOWN its Moving Average
Type : Bearish
Timeframe : Daily
Parabolic SAR indicator bearish reversal
Type : Bearish
Timeframe : Daily
Price is back under the pivot point
Type : Bearish
Timeframe : Daily
Price is back under the pivot point
Type : Bearish
Timeframe : Weekly
Momentum indicator is back under 0
Type : Bearish
Timeframe : Daily
Williams %R indicator is back under -50
Type : Bearish
Timeframe : Daily
Central Patterns, the market scanner focusing on chart patterns, resistances and supports found this result:
Support of channel is broken
Type : Bearish
Timeframe : Daily
Central Candlesticks, the scanner specialised in Japanese candlesticks, detects a bearish signal that could support the hypothesis of a small drop in the very short term:
Downside gap
Type : Bearish
Timeframe : Daily
| S3 | S2 | S1 | Price | R1 | R2 | R3 | |
|---|---|---|---|---|---|---|---|
| ProTrendLines | 31.85 | 33.39 | 35.99 | 36.16 | 40.33 | 41.88 | 48.21 |
| Change (%) | -11.92% | -7.66% | -0.47% | - | +11.53% | +15.82% | +33.32% |
| Change | -4.31 | -2.77 | -0.17 | - | +4.17 | +5.72 | +12.05 |
| Level | Intermediate | Major | Major | - | Intermediate | Intermediate | Minor |
To determine price objectives, it is also possible to use the pivot points. Here is the price position in relation to pivot points:
| Pivot points | S3 | S2 | S1 | PP | R1 | R2 | R3 |
|---|---|---|---|---|---|---|---|
| Standard | 34.50 | 35.29 | 35.80 | 36.59 | 37.10 | 37.89 | 38.40 |
| Camarilla | 35.94 | 36.06 | 36.18 | 36.30 | 36.42 | 36.54 | 36.66 |
| Woodie | 34.35 | 35.22 | 35.65 | 36.52 | 36.95 | 37.82 | 38.25 |
| Fibonacci | 35.29 | 35.79 | 36.10 | 36.59 | 37.09 | 37.40 | 37.89 |
| Pivot points | S3 | S2 | S1 | PP | R1 | R2 | R3 |
|---|---|---|---|---|---|---|---|
| Standard | 33.78 | 34.93 | 35.62 | 36.77 | 37.46 | 38.61 | 39.30 |
| Camarilla | 35.79 | 35.96 | 36.13 | 36.30 | 36.47 | 36.64 | 36.81 |
| Woodie | 33.54 | 34.82 | 35.38 | 36.66 | 37.22 | 38.50 | 39.06 |
| Fibonacci | 34.93 | 35.64 | 36.07 | 36.77 | 37.48 | 37.91 | 38.61 |
| Pivot points | S3 | S2 | S1 | PP | R1 | R2 | R3 |
|---|---|---|---|---|---|---|---|
| Standard | 31.76 | 32.71 | 34.17 | 35.12 | 36.58 | 37.53 | 38.99 |
| Camarilla | 34.97 | 35.19 | 35.41 | 35.63 | 35.85 | 36.07 | 36.29 |
| Woodie | 32.02 | 32.84 | 34.43 | 35.25 | 36.84 | 37.66 | 39.25 |
| Fibonacci | 32.71 | 33.63 | 34.20 | 35.12 | 36.04 | 36.61 | 37.53 |
Numerical data
The following is the status of technical indicators and moving averages registered at the time this technical analysis was created:
| RSI (14): | 47.83 | |
| MACD (12,26,9): | 0.4500 | |
| Directional Movement: | -10.21 | |
| AROON (14): | -14.29 | |
| DEMA (21): | 37.28 | |
| Parabolic SAR (0,02-0,02-0,2): | 37.93 | |
| Elder Ray (13): | -1.07 | |
| Super Trend (3,10): | 36.03 | |
| Zig ZAG (10): | 36.24 | |
| VORTEX (21): | 0.9900 | |
| Stochastique (14,3,5): | 46.12 | |
| TEMA (21): | 37.24 | |
| Williams %R (14): | -61.31 | |
| Chande Momentum Oscillator (20): | -0.34 | |
| Repulse (5,40,3): | -0.0700 | |
| ROCnROLL: | -1 | |
| TRIX (15,9): | 0.2300 | |
| Courbe Coppock: | 4.80 |
| MA7: | 37.21 | |
| MA20: | 36.70 | |
| MA50: | 35.61 | |
| MA100: | 33.94 | |
| MAexp7: | 36.88 | |
| MAexp20: | 36.62 | |
| MAexp50: | 35.61 | |
| MAexp100: | 34.25 | |
| Price / MA7: | -2.82% | |
| Price / MA20: | -1.47% | |
| Price / MA50: | +1.54% | |
| Price / MA100: | +6.54% | |
| Price / MAexp7: | -1.95% | |
| Price / MAexp20: | -1.26% | |
| Price / MAexp50: | +1.54% | |
| Price / MAexp100: | +5.58% |
News
The last news published on HCP INC. at the time of the generation of this analysis was as follows:
- HCP Declares Quarterly Cash Dividend on Common Stock
- HCP to Report Third Quarter 2019 Financial Results and Host Conference Call/Webcast
- HCP Upgraded by Fitch Ratings to BBB+ with Stable Outlook
- HCP Announces Series of Mutually Beneficial Transactions with Brookdale
- HCP Announces $1 Billion Commercial Paper Note Program
About author

Online


Add a comment
Comments
0 comments on the analysis HCP INC. - Daily