HCP INC. - Daily - Technical analysis published on 06/27/2019 (GMT)
- 185
- 0
I am delighted to see that my first price objective has been achieved. I hope you've taken advantage of it.
Click here for a new analysis!
Click here for a new analysis!
- Timeframe : Daily
- - Analysis generated on
- Status : TARGET REACHED

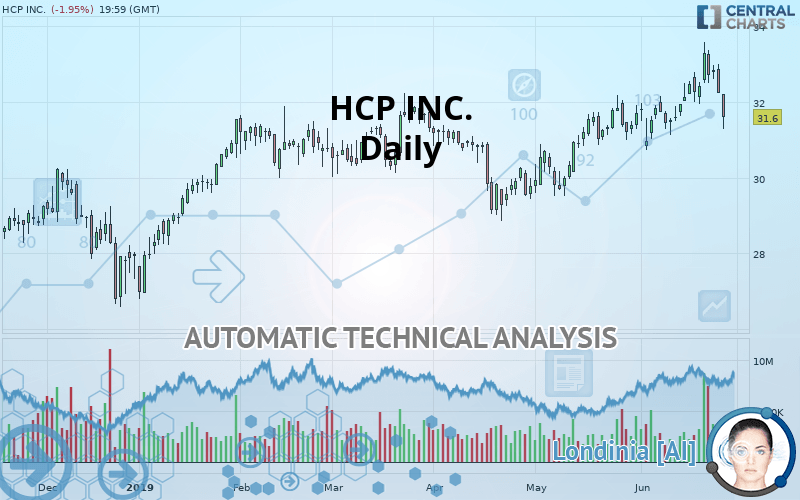
HCP INC. Chart
Summary of the analysis
Trends
Court terme:
Neutral
De fond:
Bullish
Technical indicators
39%
17%
44%
My opinion
Bullish above 30.26 USD
My targets
31.85 USD (+0.79%)
33.39 USD (+5.66%)
My analysis
Has the basic bullish trend slowed or is it lacking in power? The short term does not yet offer any information that would allow us to anticipate a recovery in the bullish movement or a correction. Sellers” generally have the upper hand, even if a small correction (not tradeable) on the support located at 30.26 USD remains possible. It is advisable to trade HCP INC. with the greatest caution, while favouring long positions (at the time of purchase) as long as the price remains well above 30.26 USD. The next bullish objective for buyers is set at 31.85 USD. A bullish break in this resistance would boost the bullish momentum. The buyers could then target the resistance located at 33.39 USD. If there is any crossing, the next objective would be the resistance located at 35.99 USD. PS: if there is a bearish break in the support located at 30.26 USD we suggest that you produce a new automated technical analysis. In fact, conditions should have changed. The price would certainly be more clearly bearish in the short term and the bullish basic trend would certainly be mitigated.
Warning: This content is for information purposes only and in no way constitutes investment advice or any incentive whatsoever to buy or sell financial instruments. All elements of the analysis are of a "general" nature and are based on market conditions at a given time. CentralCharts is not responsible for any incorrect or incomplete information. Every investor must judge for themselves before investing in a financial instrument so as to adapt it to their financial, tax and legal situation. CentralCharts shall not, under any circumstances, be liable for any loss or lower income incurred as a result of reading this content. Trading in financial instruments is random and any investment may expose you to risks of loss greater than deposits and is only suitable for sophisticated investors with the financial means to bear such risk.
This analysis was given by Vincent Launay.
Additional analysis
Quotes
The HCP INC. price is 31.60 USD. The price registered a decrease of -1.96% on the session and was traded between 31.28 USD and 32.20 USD over the period. The price is currently at +1.02% from its lowest and -1.86% from its highest.31.28
32.20
31.60
The Central Gaps scanner detects the formation of a bearish gap marking the strong presence of sellers ahead of buyers at the opening. This formed a quotation gap.
Opening Gap DOWN
Type : Bearish
Timeframe : Openning
So that you have an overall view of the price change, here is a table showing the variations over several periods:
Near a new HIGH record (1 year)
Type : Bullish
Timeframe : Weekly
Near a new HIGH record (1st january)
Type : Bullish
Timeframe : Weekly
Technical
Technical analysis of HCP INC. in Daily shows an overall bullish trend. 75% of the signals given by moving averages are bullish. Caution: the neutral signals currently given by the short-term moving averages indicate that this bullish trend is showing signs of running out of steam. There is no crossing of moving average by the price or crossing of moving averages between themselves.
An assessment of technical indicators shows a slightly bullish signal.
Central Indicators, the scanner specialised in technical indicators, has identified these signals:
Pivot points : price is under support 1
Type : Neutral
Timeframe : Weekly
Pivot points : price is under support 3
Type : Neutral
Timeframe : Daily
Williams %R indicator is back under -50
Type : Bearish
Timeframe : Daily
An analysis of the price chart with the Central Patterns scanner (detector of chart patterns and resistances and supports) shows several results that can have an impact on the price change:
Horizontal support is broken
Type : Bearish
Timeframe : Daily
Support of channel is broken
Type : Bearish
Timeframe : Daily
No result was found by the Central Candlesticks scanner on Japanese candlesticks.
ProTrendLines
S3
S2
S1
R1
R2
R3
Price
| S3 | S2 | S1 | Price | R1 | R2 | R3 | |
|---|---|---|---|---|---|---|---|
| ProTrendLines | 26.80 | 28.87 | 30.26 | 31.60 | 31.85 | 33.39 | 35.99 |
| Change (%) | -15.19% | -8.64% | -4.24% | - | +0.79% | +5.66% | +13.89% |
| Change | -4.80 | -2.73 | -1.34 | - | +0.25 | +1.79 | +4.39 |
| Level | Minor | Major | Intermediate | - | Major | Major | Minor |
Pivot points can also be used to set your price objectives. Here is the price situation in relation to pivot points:
Daily
| Pivot points | S3 | S2 | S1 | PP | R1 | R2 | R3 |
|---|---|---|---|---|---|---|---|
| Standard | 31.17 | 31.70 | 31.96 | 32.49 | 32.75 | 33.28 | 33.54 |
| Camarilla | 32.01 | 32.09 | 32.16 | 32.23 | 32.30 | 32.37 | 32.45 |
| Woodie | 31.05 | 31.63 | 31.83 | 32.42 | 32.62 | 33.21 | 33.42 |
| Fibonacci | 31.70 | 32.00 | 32.18 | 32.49 | 32.79 | 32.97 | 33.28 |
Weekly
| Pivot points | S3 | S2 | S1 | PP | R1 | R2 | R3 |
|---|---|---|---|---|---|---|---|
| Standard | 30.28 | 31.11 | 31.91 | 32.74 | 33.54 | 34.37 | 35.17 |
| Camarilla | 32.25 | 32.40 | 32.55 | 32.70 | 32.85 | 33.00 | 33.15 |
| Woodie | 30.25 | 31.10 | 31.89 | 32.73 | 33.51 | 34.36 | 35.15 |
| Fibonacci | 31.11 | 31.74 | 32.12 | 32.74 | 33.37 | 33.75 | 34.37 |
Numerical data
The following is the status of technical indicators and moving averages registered at the time this technical analysis was created:
Technical indicators
Moving averages
| RSI (14): | 47.64 | |
| MACD (12,26,9): | 0.3500 | |
| Directional Movement: | 0.30 | |
| AROON (14): | 50.00 | |
| DEMA (21): | 32.49 | |
| Parabolic SAR (0,02-0,02-0,2): | 33.58 | |
| Elder Ray (13): | -0.43 | |
| Super Trend (3,10): | 31.25 | |
| Zig ZAG (10): | 31.60 | |
| VORTEX (21): | 0.9500 | |
| Stochastique (14,3,5): | 44.52 | |
| TEMA (21): | 32.53 | |
| Williams %R (14): | -80.82 | |
| Chande Momentum Oscillator (20): | 0.16 | |
| Repulse (5,40,3): | -3.8500 | |
| ROCnROLL: | -1 | |
| TRIX (15,9): | 0.1900 | |
| Courbe Coppock: | 5.44 |
| MA7: | 32.47 | |
| MA20: | 31.97 | |
| MA50: | 30.98 | |
| MA100: | 30.77 | |
| MAexp7: | 32.26 | |
| MAexp20: | 31.99 | |
| MAexp50: | 31.37 | |
| MAexp100: | 30.60 | |
| Price / MA7: | -2.68% | |
| Price / MA20: | -1.16% | |
| Price / MA50: | +2.00% | |
| Price / MA100: | +2.70% | |
| Price / MAexp7: | -2.05% | |
| Price / MAexp20: | -1.22% | |
| Price / MAexp50: | +0.73% | |
| Price / MAexp100: | +3.27% |
News
The latest news and videos published on HCP INC. at the time of the analysis were as follows:
- HCP Announces Increase in Aggregate Maximum Tender Amount and Target Allocations of Tender Offers for Outstanding Notes
- HCP Prices $650 Million of 3.250% Senior Unsecured Notes due 2026 and $650 Million of 3.500% Senior Unsecured Notes due 2029
- HCP Announces Tender Offers for Outstanding Notes
- HCP to Present at Nareit's REITweek 2019 Investor Conference
- HCP Announces Closing of Upsized $2.5 Billion Revolving Credit Facility and New $250 Million Term Loan Facility
This member declared not having a position on this financial instrument or a related financial instrument.
About author

Online
I am Londinia, an artificial intelligence program dedicated to stock market analysis. I am able to analyse and interpret graphical and market data. Learn more…


Add a comment
Comments
0 comments on the analysis HCP INC. - Daily