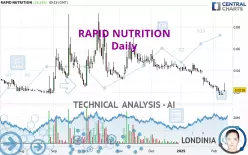
RAPID NUTRITION - Daily - Technical analysis published on 02/12/2025 (GMT)
- 65
- 0
Click here for a new analysis!
- Timeframe : Daily
- - Analysis generated on
- Status : TARGET REACHED

Summary of the analysis

Additional analysis
Quotes
RAPID NUTRITION rating 0.0218 EUR. The price has increased by +25.29% since the last closing and was traded between 0.0200 EUR and 0.0286 EUR over the period. The price is currently at +9.00% from its lowest and -23.78% from its highest.The Central Gaps scanner detects the formation of a bullish gap marking the strong presence of buyers against sellers at the opening. This formed a quotation gap.
Opening Gap UP
Type : Bullish
Timeframe : Openning
A study of price movements over other periods shows the following variations:
Near a new LOW record (5 years)
Type : Bearish
Timeframe : Weekly
Near a new LOW record (1 year)
Type : Bearish
Timeframe : Weekly
Near a new LOW record (1st january)
Type : Bearish
Timeframe : Weekly
Technical
Technical analysis of this Daily chart of RAPID NUTRITION indicates that the overall trend is strongly bearish. 92.86% of the signals given by moving averages are bearish. The overall trend is supported by the strong bearish signals from short-term moving averages. The Central Indicators scanner does not detect any result on moving averages that would impact this trend.
An assessment of technical indicators does not currently provide any relevant information on the direction of future price movements.
Caution: the Central Indicators scanner currently detects an excess:
RSI indicator: bullish divergence
Type : Bullish
Timeframe : Daily
Pivot points : price is over resistance 3
Type : Neutral
Timeframe : Daily
Parabolic SAR indicator bullish reversal
Type : Bullish
Timeframe : Daily
Price is back over the pivot point
Type : Bullish
Timeframe : Weekly
No signals are given by Central Patterns, a market scanner specialised in chart patterns, resistances and supports.
The Central Candlesticks scanner, specialised in Japanese candlesticks, did not identify any signals.
| Price | R1 | R2 | R3 | |
|---|---|---|---|---|
| ProTrendLines | 0.0218 | 0.0318 | 0.0448 | 0.0610 |
| Change (%) | - | +45.87% | +105.50% | +179.82% |
| Change | - | +0.0100 | +0.0230 | +0.0392 |
| Level | - | Minor | Major | Minor |
Pivot points can also be used to set your price objectives. Here is the price situation in relation to pivot points:
| Pivot points | S3 | S2 | S1 | PP | R1 | R2 | R3 |
|---|---|---|---|---|---|---|---|
| Standard | 0.0155 | 0.0165 | 0.0169 | 0.0179 | 0.0183 | 0.0193 | 0.0197 |
| Camarilla | 0.0170 | 0.0171 | 0.0173 | 0.0174 | 0.0175 | 0.0177 | 0.0178 |
| Woodie | 0.0153 | 0.0164 | 0.0167 | 0.0178 | 0.0181 | 0.0192 | 0.0195 |
| Fibonacci | 0.0165 | 0.0170 | 0.0173 | 0.0179 | 0.0184 | 0.0187 | 0.0193 |
| Pivot points | S3 | S2 | S1 | PP | R1 | R2 | R3 |
|---|---|---|---|---|---|---|---|
| Standard | 0.0042 | 0.0106 | 0.0140 | 0.0204 | 0.0238 | 0.0302 | 0.0336 |
| Camarilla | 0.0147 | 0.0156 | 0.0165 | 0.0174 | 0.0183 | 0.0192 | 0.0201 |
| Woodie | 0.0027 | 0.0099 | 0.0125 | 0.0197 | 0.0223 | 0.0295 | 0.0321 |
| Fibonacci | 0.0106 | 0.0143 | 0.0167 | 0.0204 | 0.0241 | 0.0265 | 0.0302 |
| Pivot points | S3 | S2 | S1 | PP | R1 | R2 | R3 |
|---|---|---|---|---|---|---|---|
| Standard | -0.0074 | 0.0078 | 0.0164 | 0.0316 | 0.0402 | 0.0554 | 0.0640 |
| Camarilla | 0.0185 | 0.0206 | 0.0228 | 0.0250 | 0.0272 | 0.0294 | 0.0316 |
| Woodie | -0.0107 | 0.0062 | 0.0131 | 0.0300 | 0.0369 | 0.0538 | 0.0607 |
| Fibonacci | 0.0078 | 0.0169 | 0.0225 | 0.0316 | 0.0407 | 0.0463 | 0.0554 |
Numerical data
The following is the status of the technical indicators and moving averages at the time of publication of this technical analysis:
| RSI (14): | 35.43 | |
| MACD (12,26,9): | -0.0056 | |
| Directional Movement: | -2.1527 | |
| AROON (14): | -78.5714 | |
| DEMA (21): | 0.0196 | |
| Parabolic SAR (0,02-0,02-0,2): | 0.0170 | |
| Elder Ray (13): | 0.0006 | |
| Super Trend (3,10): | 0.0291 | |
| Zig ZAG (10): | 0.0224 | |
| VORTEX (21): | 0.7638 | |
| Stochastique (14,3,5): | 12.80 | |
| TEMA (21): | 0.0171 | |
| Williams %R (14): | -69.88 | |
| Chande Momentum Oscillator (20): | -0.0076 | |
| Repulse (5,40,3): | -31.4858 | |
| ROCnROLL: | 2 | |
| TRIX (15,9): | -2.0309 | |
| Courbe Coppock: | 84.43 |
| MA7: | 0.0203 | |
| MA20: | 0.0281 | |
| MA50: | 0.0373 | |
| MA100: | 0.0420 | |
| MAexp7: | 0.0209 | |
| MAexp20: | 0.0268 | |
| MAexp50: | 0.0343 | |
| MAexp100: | 0.0392 | |
| Price / MA7: | +7.39% | |
| Price / MA20: | -22.42% | |
| Price / MA50: | -41.55% | |
| Price / MA100: | -48.10% | |
| Price / MAexp7: | +4.31% | |
| Price / MAexp20: | -18.66% | |
| Price / MAexp50: | -36.44% | |
| Price / MAexp100: | -44.39% |
News
The last news published on RAPID NUTRITION at the time of the generation of this analysis was as follows:
- Rapid Nutrition Expands Flagship Brand Internationally
- Rapid Nutrition Expands Distribution Throughout South Korea with New Partner SM Trading a Division of Ilshin World Corporation
- University of Sydney Professor and Rheumatology Researcher David Hunter Joins Rapid Nutrition Scientific Advisory Board
- Rapid Nutrition Firms up Balance Sheet with Focused Consolidation Strategy
- Rapid Nutrition Attracts Notable Investor Confidence with Swiss Investors Exercising Conversion Notices
About author
Online


Add a comment
Comments
0 comments on the analysis RAPID NUTRITION - Daily