ARAMIS GROUP - Daily - Technical analysis published on 01/26/2023 (GMT)
- 175
- 0
Click here for a new analysis!
- Timeframe : Daily
- - Analysis generated on
- Status : INVALID

Summary of the analysis

Additional analysis
Quotes
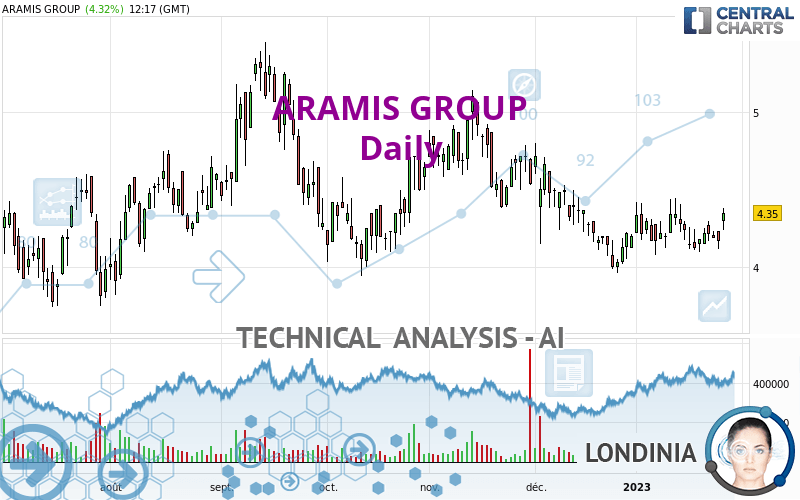
The ARAMIS GROUP price is 4.350 EUR. The price registered an increase of +4.32% on the session and was traded between 4.240 EUR and 4.380 EUR over the period. The price is currently at +2.59% from its lowest and -0.68% from its highest.The Central Gaps scanner detects the formation of a bullish gap marking the strong presence of buyers against sellers at the opening. This formed a quotation gap.
Opening Gap UP
Type : Bullish
Timeframe : Openning
Here is a more detailed summary of the historical variations registered by ARAMIS GROUP:
Near a new LOW record (1st january)
Type : Bearish
Timeframe : Weekly
Near a new HIGH record (1 month)
Type : Bullish
Timeframe : Weekly
Technical
Technical analysis of this Daily chart of ARAMIS GROUP indicates that the overall trend is slightly bearish. Only 57.14% of the signals given by moving averages are bearish. This slightly bearish trend could quickly be reversed due to the strong bullish signals currently being given by short-term moving averages. The Central Indicators market scanner is currently detecting several bullish signals that could impact this trend:
Bullish price crossover with Moving Average 20
Type : Bullish
Timeframe : Daily
Bullish price crossover with adaptative moving average 20
Type : Bullish
Timeframe : Daily
The technical indicators are bullish. There is still some doubt about the price increase.
Caution: the Central Indicators scanner currently detects an excess:
CCI indicator is overbought : over 100
Type : Neutral
Timeframe : Daily
MACD indicator: bullish divergence
Type : Bullish
Timeframe : Daily
Pivot points : price is over resistance 1
Type : Neutral
Timeframe : Weekly
Pivot points : price is over resistance 3
Type : Neutral
Timeframe : Daily
RSI indicator is back over 50
Type : Bullish
Timeframe : Daily
Parabolic SAR indicator bullish reversal
Type : Bullish
Timeframe : Daily
Momentum indicator is back over 0
Type : Bullish
Timeframe : Daily
Williams %R indicator is back over -50
Type : Bullish
Timeframe : Daily
The Central Patterns scanner, which studies chart patterns, resistances and supports, has identified these signals:
Near horizontal resistance
Type : Bearish
Timeframe : Daily
Near resistance of channel
Type : Bearish
Timeframe : Daily
Near resistance of triangle
Type : Bearish
Timeframe : Daily
The Central Candlesticks scanner, specialised in Japanese candlesticks, did not identify any signals.
| S3 | S2 | S1 | Price | R1 | R2 | R3 | |
|---|---|---|---|---|---|---|---|
| ProTrendLines | 3.776 | 4.050 | 4.337 | 4.350 | 4.626 | 5.310 | 5.815 |
| Change (%) | -13.20% | -6.90% | -0.30% | - | +6.34% | +22.07% | +33.68% |
| Change | -0.574 | -0.300 | -0.013 | - | +0.276 | +0.960 | +1.465 |
| Level | Minor | Major | Intermediate | - | Minor | Intermediate | Minor |
To determine price objectives, it is also possible to use the pivot points. Here is the price position in relation to pivot points:
| Pivot points | S3 | S2 | S1 | PP | R1 | R2 | R3 |
|---|---|---|---|---|---|---|---|
| Standard | 4.001 | 4.061 | 4.115 | 4.175 | 4.229 | 4.289 | 4.343 |
| Camarilla | 4.139 | 4.149 | 4.160 | 4.170 | 4.181 | 4.191 | 4.201 |
| Woodie | 3.999 | 4.060 | 4.113 | 4.174 | 4.227 | 4.288 | 4.341 |
| Fibonacci | 4.061 | 4.104 | 4.131 | 4.175 | 4.218 | 4.245 | 4.289 |
| Pivot points | S3 | S2 | S1 | PP | R1 | R2 | R3 |
|---|---|---|---|---|---|---|---|
| Standard | 3.913 | 4.007 | 4.113 | 4.207 | 4.313 | 4.407 | 4.513 |
| Camarilla | 4.165 | 4.183 | 4.202 | 4.220 | 4.238 | 4.257 | 4.275 |
| Woodie | 3.920 | 4.010 | 4.120 | 4.210 | 4.320 | 4.410 | 4.520 |
| Fibonacci | 4.007 | 4.083 | 4.130 | 4.207 | 4.283 | 4.330 | 4.407 |
| Pivot points | S3 | S2 | S1 | PP | R1 | R2 | R3 |
|---|---|---|---|---|---|---|---|
| Standard | 3.000 | 3.480 | 3.840 | 4.320 | 4.680 | 5.160 | 5.520 |
| Camarilla | 3.969 | 4.046 | 4.123 | 4.200 | 4.277 | 4.354 | 4.431 |
| Woodie | 2.940 | 3.450 | 3.780 | 4.290 | 4.620 | 5.130 | 5.460 |
| Fibonacci | 3.480 | 3.801 | 3.999 | 4.320 | 4.641 | 4.839 | 5.160 |
Numerical data
The following is the status of technical indicators and moving averages registered at the time this technical analysis was created:
| RSI (14): | 55.61 | |
| MACD (12,26,9): | -0.0250 | |
| Directional Movement: | 5.362 | |
| AROON (14): | 28.571 | |
| DEMA (21): | 4.191 | |
| Parabolic SAR (0,02-0,02-0,2): | 4.100 | |
| Elder Ray (13): | 0.084 | |
| Super Trend (3,10): | 4.506 | |
| Zig ZAG (10): | 4.346 | |
| VORTEX (21): | 1.0300 | |
| Stochastique (14,3,5): | 41.91 | |
| TEMA (21): | 4.224 | |
| Williams %R (14): | -28.90 | |
| Chande Momentum Oscillator (20): | 0.148 | |
| Repulse (5,40,3): | 0.3500 | |
| ROCnROLL: | -1 | |
| TRIX (15,9): | -0.1440 | |
| Courbe Coppock: | 0.20 |
| MA7: | 4.207 | |
| MA20: | 4.230 | |
| MA50: | 4.346 | |
| MA100: | 4.491 | |
| MAexp7: | 4.233 | |
| MAexp20: | 4.236 | |
| MAexp50: | 4.324 | |
| MAexp100: | 4.514 | |
| Price / MA7: | +3.40% | |
| Price / MA20: | +2.84% | |
| Price / MA50: | +0.09% | |
| Price / MA100: | -3.14% | |
| Price / MAexp7: | +2.76% | |
| Price / MAexp20: | +2.69% | |
| Price / MAexp50: | +0.60% | |
| Price / MAexp100: | -3.63% |
News
The last news published on ARAMIS GROUP at the time of the generation of this analysis was as follows:
- Aramis Group - Half-yearly statement of the company's liquidity contract
- Aramis Group - 2022 annual results
- Cazoo sells its Italian operations to Aramis Group
- Aramis Group - Finalization of the acquisition of Onlinecars
- ARAMIS GROUP - Half-yearly statement of the company's liquidity contract
About author
Online


Add a comment
Comments
0 comments on the analysis ARAMIS GROUP - Daily